Reanalyzing vascular repair after myocardial infarction
I reanalyze the published single-cell and spatial transcriptomic data from Tung et al. to examine how vessel-associated cells and their RNA profiles differ across sampled stages after myocardial infarction in mice, and where activation-associated RNA appears in heart sections.
This matters because forming blood vessels is not sufficient for cardiac repair: vessels also need supporting cells and an appropriate tissue environment to remain stable. Tung and colleagues investigated these changes in the context of progressive vascular loss after myocardial infarction.
My reanalysis asks what conclusions the deposited measurements support. In the single-cell analysis, I test how filtering and clustering affect those conclusions. The study’s sampling structure and incomplete animal-identification information limit what I can establish about consistency across mice.
What this project shows
I use single-cell RNA-seq to characterize vessel-supporting cell clusters and test how their inferred identities depend on filtering and clustering. With spatial transcriptomics, I examine whether an activation-associated RNA signature is stronger in tissue regions with molecular signs of injury.
Vessel-supporting-cell RNA patterns across injury times: a cycling/matrix/contractile pericyte cluster and a VSMC cluster with stronger contraction-related expression are most represented at D3; a collagen-related pericyte cluster is prominent at D7. Correspondence with the authors’ activated pericytes remains unassessed. Cluster expression and interpretation.
How stable is the pericyte assignment? Stricter gene filtering (>300 detected genes) followed by reclustering leaves 16 of the original 497 C7 cells labeled as pericytes; coarser clustering (Leiden resolution 0.25) leaves 26. All 497 cells remain in both analyses—their labels change because cell types are assigned at the cluster level. Same-cell comparison and interpretation.
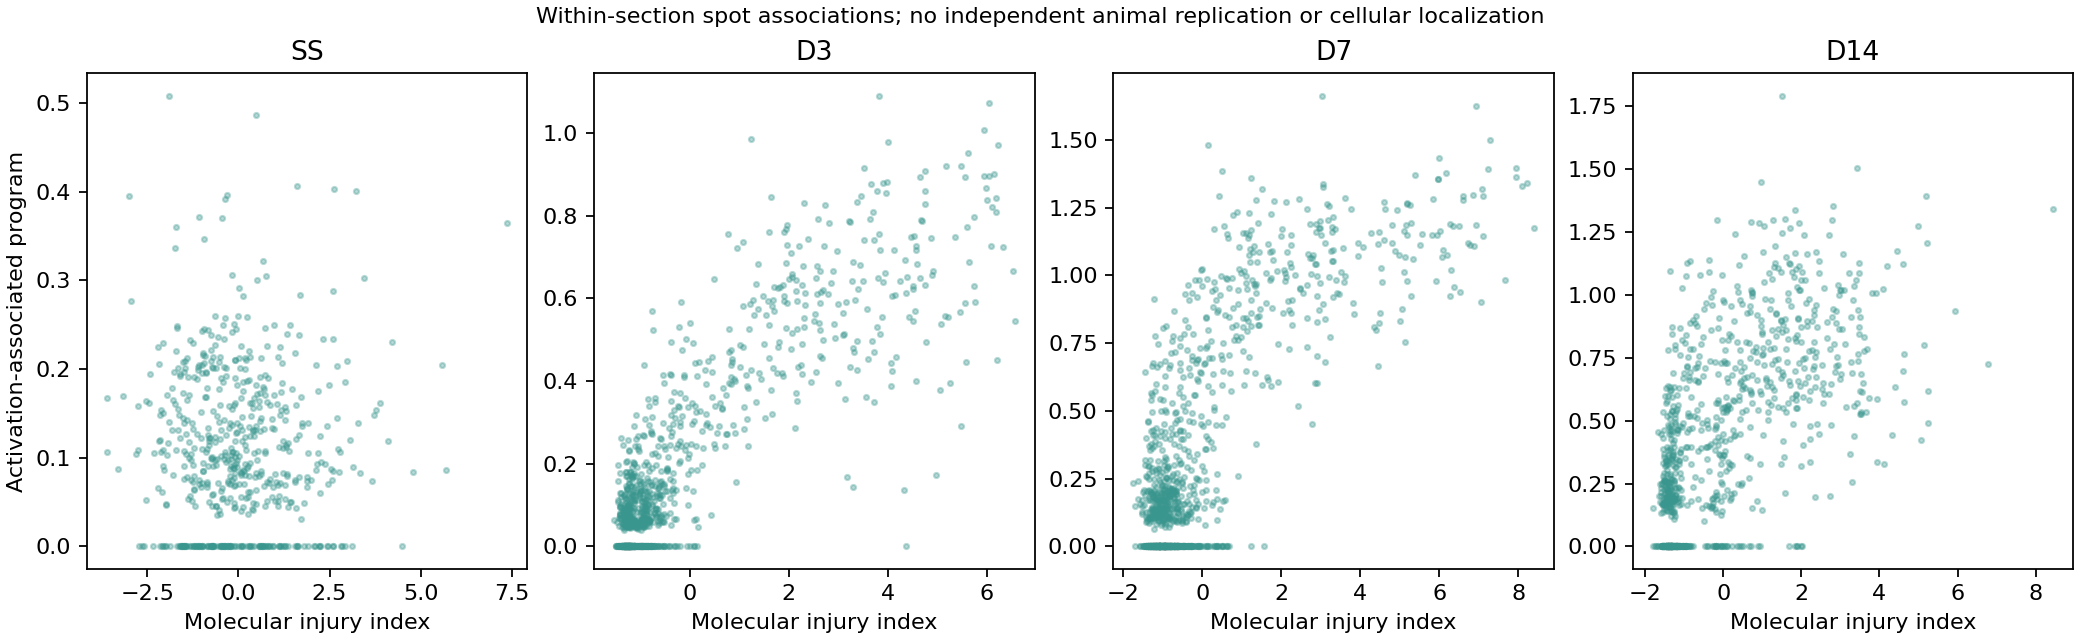
Matrix-remodeling and vascular RNA patterns track molecular signs of injury: the score for genes associated with activated pericytes in Tung’s paper correlates positively with the injury index in the D3 and D7 spatial transcriptomics sections (Spearman 0.742 and 0.606). These mixed-cell measurements do not establish that pericytes produce the signal. Spatial maps and interpretation.
Because the deposited datasets do not provide recoverable animal-level replication for these comparisons, the results describe patterns in the available cells and tissue sections but cannot estimate how consistently those patterns recur across mice.
The supporting work covers count-matrix QC, annotation, descriptive expression comparisons, GO enrichment and spatial analysis in a modular Nextflow workflow.
Scientific limitations are stated beside the findings.
Study design sets the boundaries
The authors use a mouse heart-attack model to study how vessel-supporting cells respond to injury and where tissue changes occur. These two experiments sample hearts at different endpoints, rather than follow the same heart through recovery.
SS = uninjured steady state; D = days after injury. Dataset counts below are not counts of mice.
CD146-selected cells, enriched for vessel-supporting mural cells.
SS, D3, D7 and D42 Four deposited time-point datasets.
The authors’ expression tests compare cells, but do not show how consistently a change occurs across mice. Differences between time points could also come from how the samples were processed.
RNA measured at known positions in transverse heart sections.
SS, D3, D7 and D14 Four deposited spatial datasets.
Each spot measures a mix of cells. More spots from the same heart give a more detailed view, not more independent hearts.
Differences across time can also reflect which heart was sampled and how its tissue was processed.
Comparing damaged tissue with a distant (“remote”) area compares two regions of the same injured heart—not an injured mouse with an uninjured one.
The project, question by question
From the experimental question to measured answers and their limits.
Question
Analysis
Answer and evidence
01Which observations pass quality checks, and what remains uncertain?
Input verification, RNA QC and doublet assessment
Separate available measurements from the retained analysis cohort.
The frozen RNA-quality rules retain 17,107 of 19,106 barcodes. Predicted doublets remain visible in the primary cohort.Inspect evidence for quality, finding 1
RNA counts are available in all four matrices; only D3 has sample-tag features. A verified cell-to-animal map is not recovered for the complete series.Inspect evidence for quality, finding 2
02Which broad cell identities are supported?
Normalization, clustering, multi-marker annotation and sensitivity analysis
Use marker evidence to interpret clusters, then check dependence on analysis choices.
Across alternative analyses, 88.0% to 98.9% of cells present in both the primary and alternative analysis retain the same broad cell-type label.Inspect evidence for identities, finding 2
03How do captured populations and pericyte expression vary with injury time?
Per-library composition and descriptive expression contrasts
Distinguish which cells are represented from how their RNA measurements differ.
Pericytes form a larger share of the captured cells at each injury time than at SS. These fractions describe the selected samples.Inspect evidence for injury, finding 1
For the matrix gene Col1a1, the D7-to-SS log2 expression ratio is 2.12. For Nrip2 at D42, the direction of the difference reverses under an alternative clustering seed.Inspect evidence for injury, finding 2
04Which biological processes are associated with the expression differences?
GO functional enrichment and contributing-gene expression
Connect gene-list overlap to the actual genes and measurements behind it.
Genes with lower expression at D3 relative to SS are enriched for muscle system process. Genes with higher expression at D7 relative to SS are enriched for extracellular matrix organization. Genes with higher expression at D42 relative to SS are enriched for cytoplasmic translation.Inspect evidence for function, finding 1
The gene-level view shows which genes contribute to cytoplasmic translation and how their expression differs across injury times.Inspect evidence for function, finding 2
05What does tissue location add?
Spatial transcriptomics and within-section molecular comparison
Recover tissue position without treating mixed spots as identified individual cells.
The spatial maps compare a fixed activation-associated RNA program with a molecular injury index within each deposited section.Inspect evidence for spatial, finding 1
At day 3, the activation-associated RNA signature is stronger where the injury-related RNA index is higher. These measurements cannot identify the cells producing the signal.Inspect evidence for spatial, finding 2
What the evidence adds up to
What I learned
Broad pericytes form a larger share of the captured injury libraries than of SS. D7 increased genes emphasize extracellular-matrix organization, whereas D42 increased genes emphasize cytoplasmic translation. The D3 within-section association places activation-associated RNA along a molecular injury gradient. Together these are selected-cell and mixed-tissue associations, not repeated animal effects or a causal explanation for vessel loss.
These data describe selected cells and individual tissue sections. They do not resolve whether changes repeat across mice, whether more captured cells mean more cells in the heart, or whether a pericyte program causes vessel loss.
The sensitivity results show which interpretations depend on filtering and annotation. Mixed spatial measurements leave the cells producing the RNA signal unresolved.
Historical four-claim comparison
The earlier operational reproduction tested a cycling pericyte-like candidate, not the new broad-pericyte population. Its recorded verdicts remain separate:
Earlier claim
Historical operational verdict
Boundary
Pericyte-like identity
Reproduced
Held-out marker checks under the older candidate rule.
Cycle, matrix and vascular programs
Not assessable
D7 had 13 candidates, below the prespecified 20-cell minimum.
Temporal representation
Reproduced
Captured cycling-candidate fractions, not tissue abundance.
Infarct association
Partly reproduced
Molecular spatial proxy; cellular localization remained not assessable.
I propose matched, mouse-identified RNA and tissue measurements with sham controls and injury times balanced across processing batches. Per-cell matrix expression and independent tissue cell counts would distinguish within-pericyte changes from changing mixtures or capture; matched coverage/perfusion would test the functional association.
The paper already contains EdU, lineage tracing, histology and perfusion evidence. The proposed addition is matched animal-level replication and cell-resolved attribution, not a claim those assays are missing. Existing source assays, design, controls and contrasting outcomes. A causal test and its sample-size justification require separate prospective design; no new experiment was performed here.
My contribution—and how to inspect it
I connect the experimental question to input checks, modular analysis, documented cell annotations and results others can inspect. I used AI assistance for implementation and review. Reanalysis of these data does not provide independent experimental validation.
Workflow: deposited counts → QC/doublets → full-gene normalization and clustering → reviewed annotation → descriptive contrasts and GO → bounded spatial analysis → linked figures, tables and report.
Source run: output/portfolio/pc001-full-2026-09-12-01. Complete-run task count: 116. The linked execution record distinguishes actual resume/fresh-run checks from synthetic tests; workflow completion alone does not certify the biology.
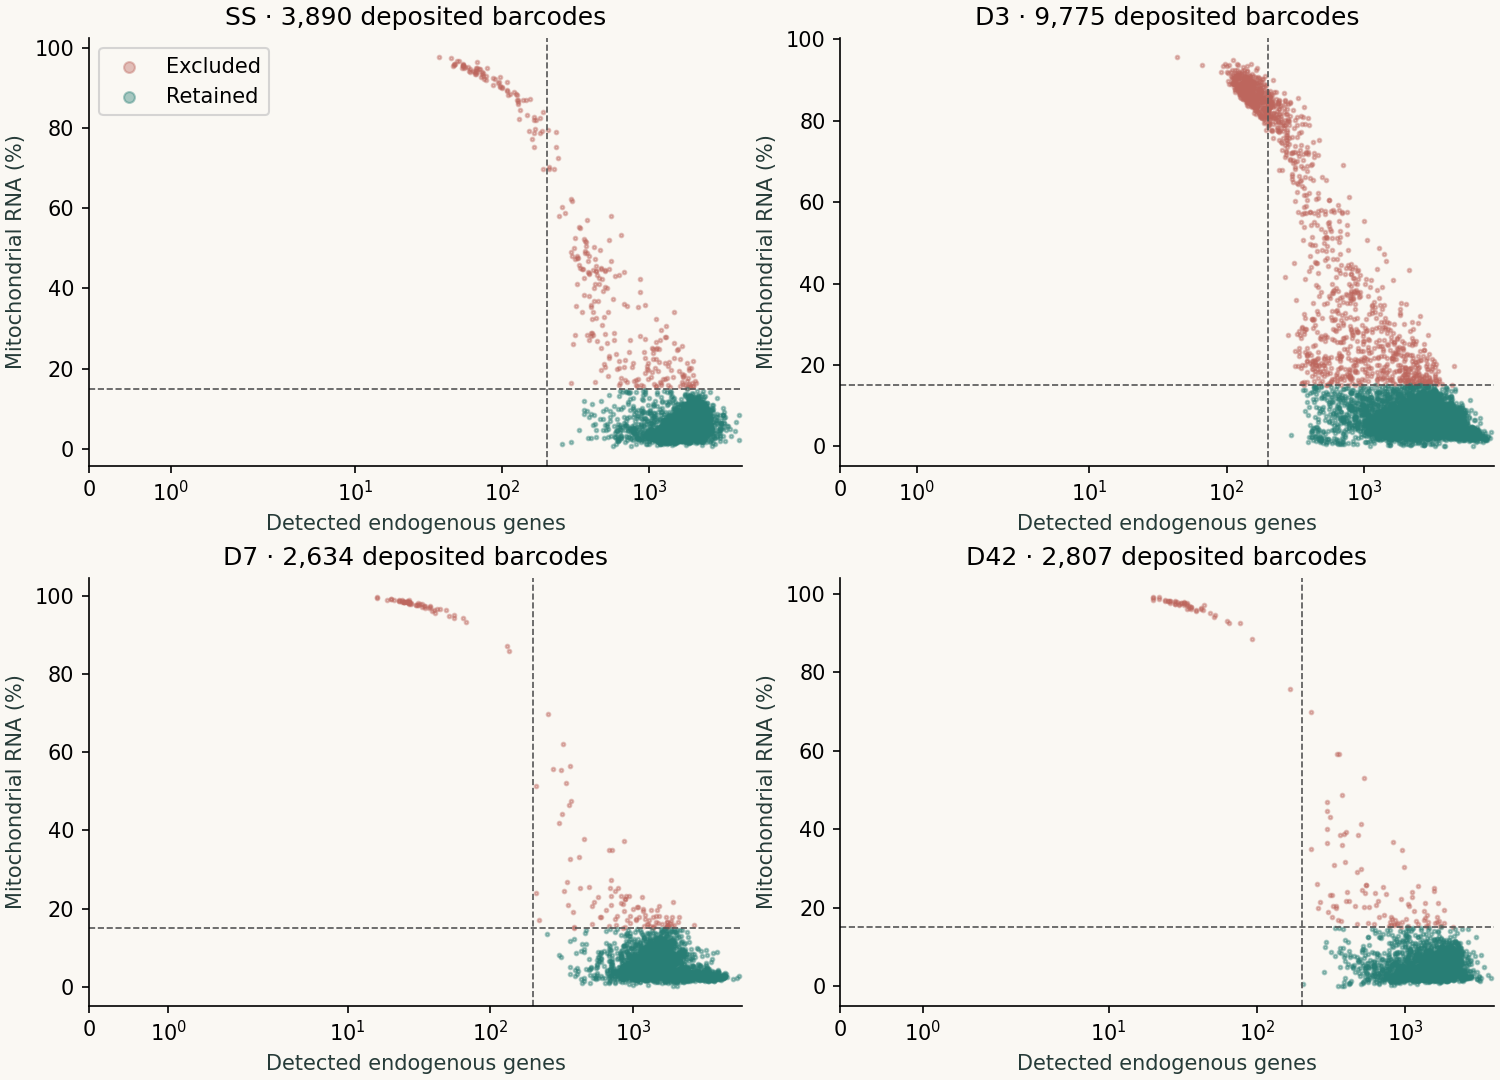
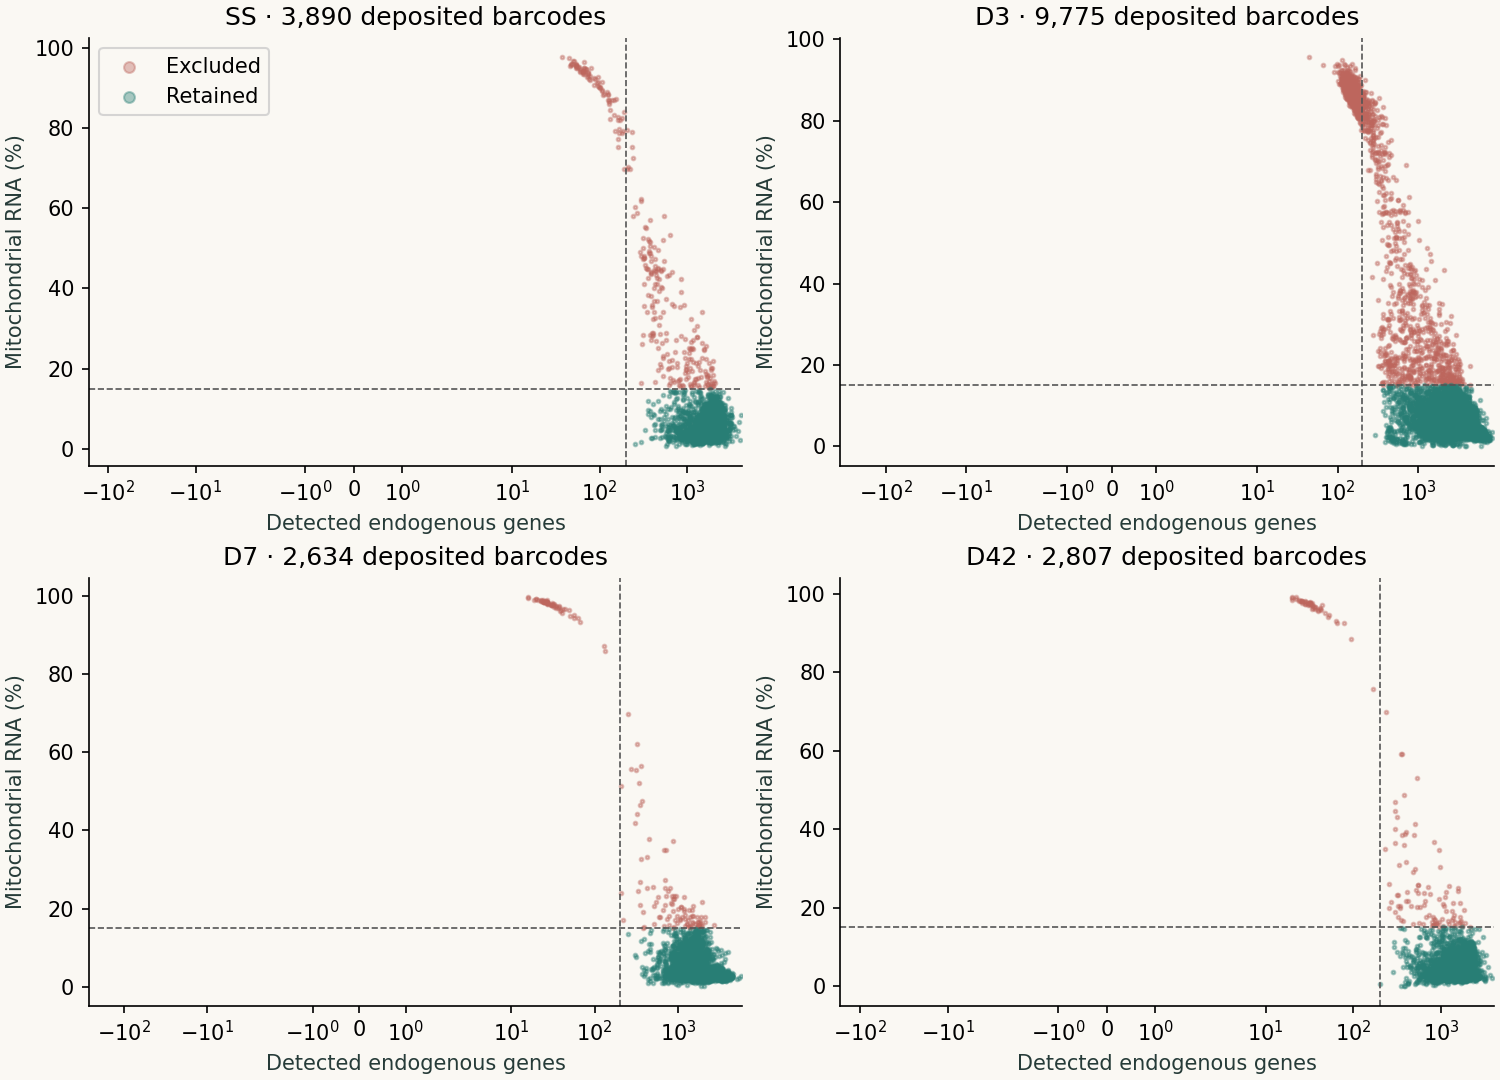
Each point is a deposited barcode. Detected endogenous genes and mitochondrial RNA fraction describe different aspects of its RNA measurement. The frozen primary rule requires more than 200 genes, less than 15% mitochondrial RNA and positive endogenous counts.
What this answers
The primary cohort retains 17,107 of 19,106 observations: SS 3,594/3,890; D3 8,379/9,775; D7 2,474/2,634; D42 2,660/2,807. These are filtering differences, not evidence that injury caused poor cell quality.
Where this evidence stops
Passing QC does not prove that a barcode is a single cell or a pericyte. Predicted doublets remain in the primary cohort; filtered inputs do not supply a newly verified empty-droplet background.
My analysisRetention under prespecified alternatives
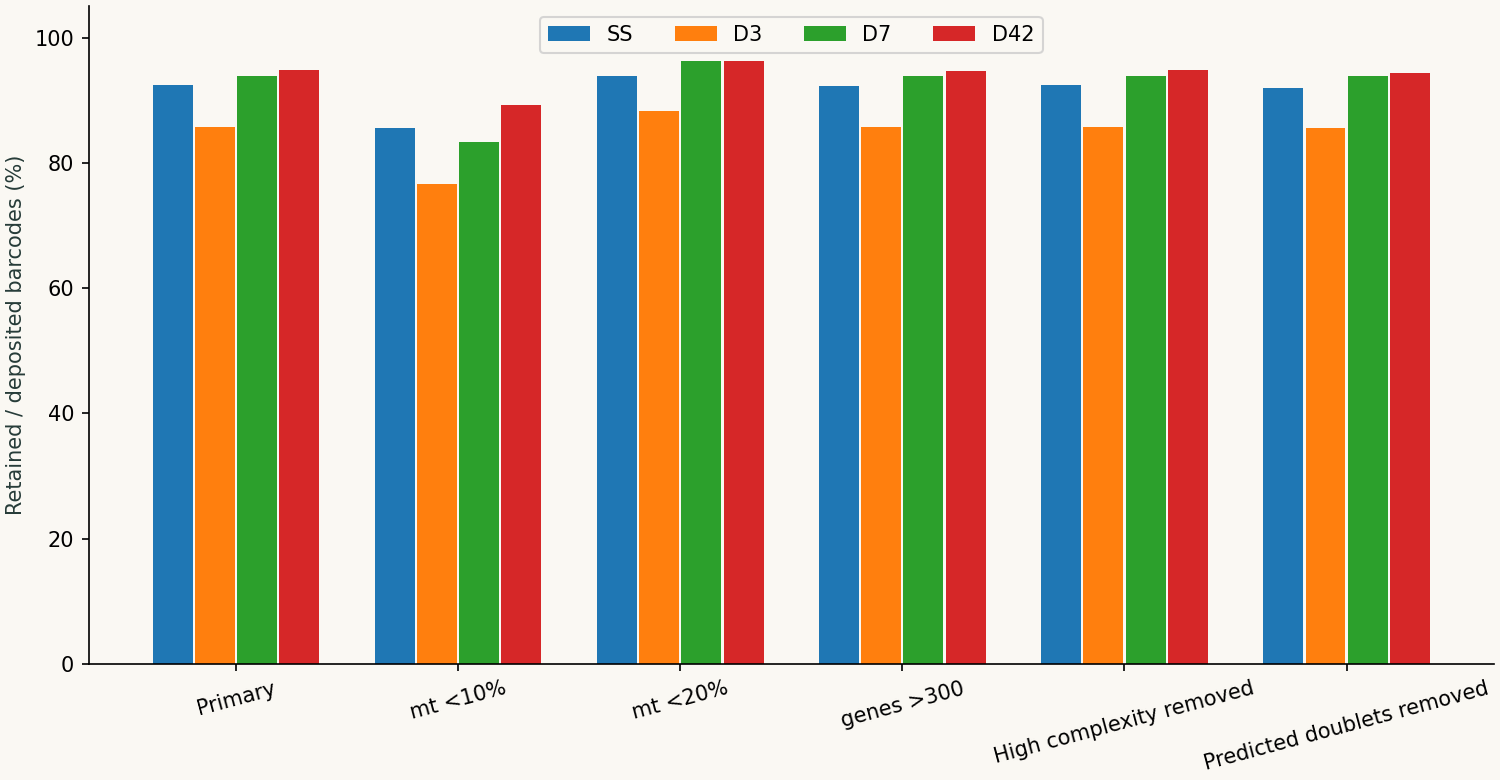
Compare each alternative with the primary rule using the same deposited-library denominator. A taller bar means more retained observations, not better data.
What this answers
The stricter and more permissive mitochondrial cutoffs, detected-gene cutoff, high-complexity removal and predicted-doublet removal expose which observations depend on filtering choices.
Where this evidence stops
Similar retained totals can hide different cells. Downstream identity and expression sensitivities, not retention alone, assess the impact on biological interpretation.
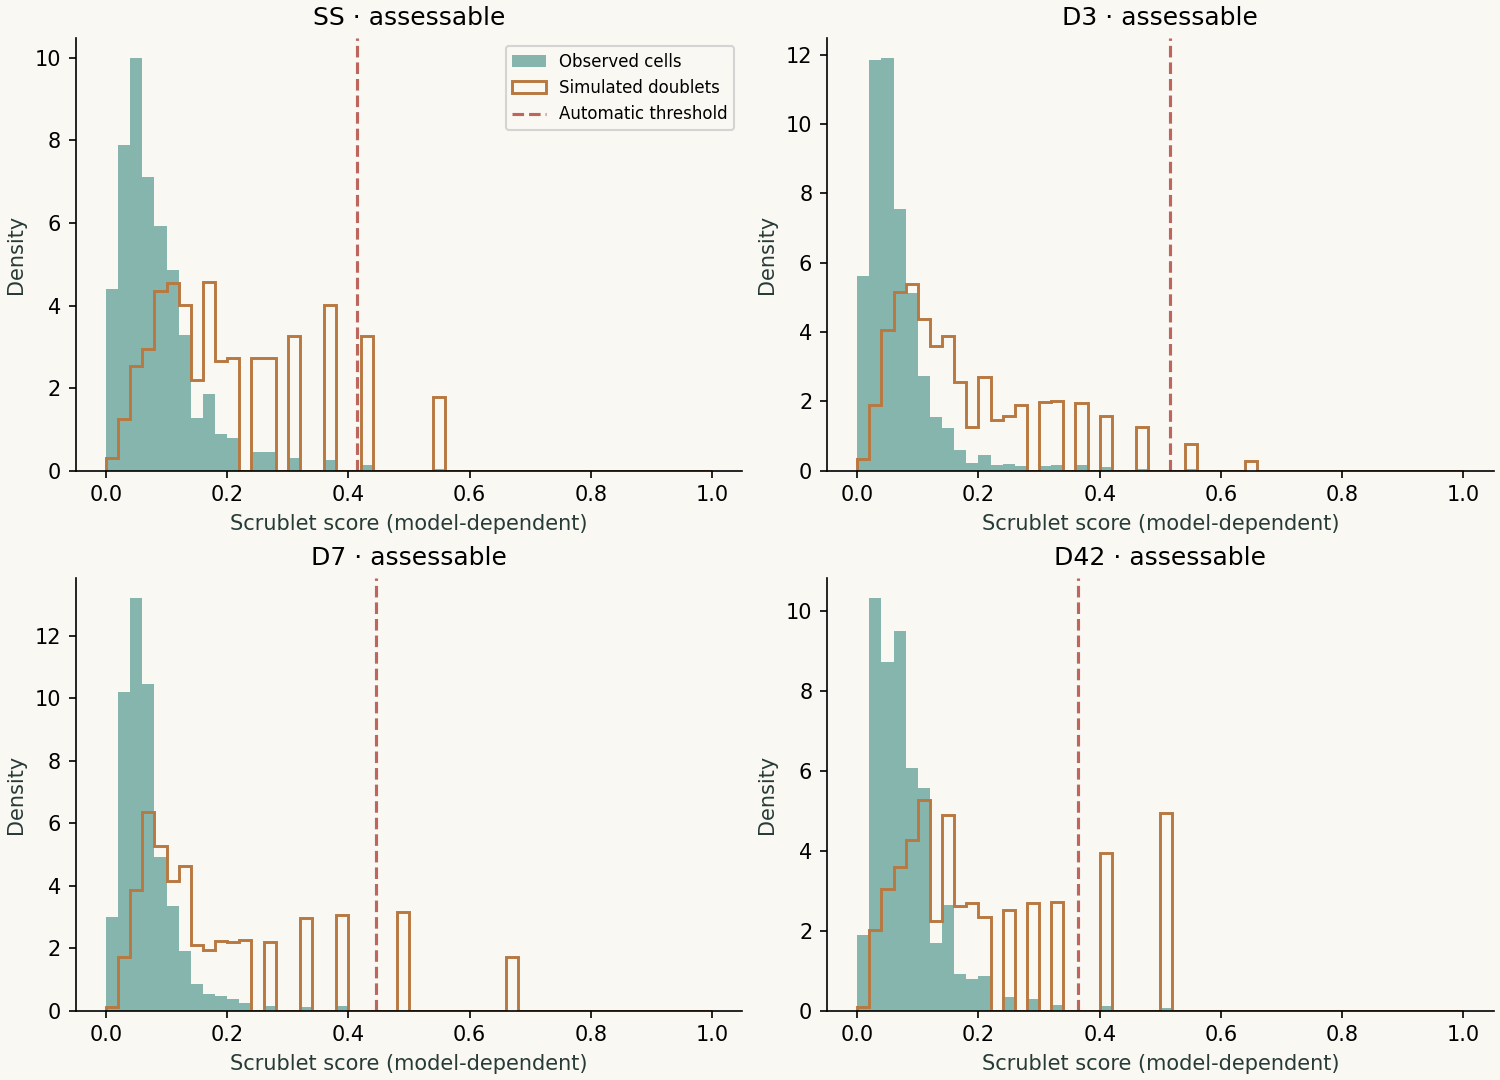
Similar-cell mixtures can be missed, and assumed loading rates affect calls. The primary analysis retains flags; the removal sensitivity and missing-call status stay explicit. Sample-tag demultiplexing is not claimed.
Publication Methods · No matching result plotRelated processing, not an identical QC recipe
The Methods describe dataset-tailored gene, RNA-count and mitochondrial thresholds.
How my analysis differs
I use separately frozen Scanpy processing and expose high-complexity and doublet sensitivities. These new QC diagnostics are not an exact reproduction of the authors’ selection.
Where this evidence stops
Different filters can retain different cells. Neither recipe recovers missing animal identities or resolves possible time–processing confounding.
Finding 1.2 · Recorded evidence
The inputs support RNA analysis, but not recovered animal-level replication.
Input and retained observations · Not miceCD146 injury-series inventory
Deposited barcodes are starting observations; retained barcodes pass my RNA-quality rules. Neither column counts mice.
What this answers
Each matrix contains 32,287 gene-expression features, including two constructs; the new single-cell analysis preserves 32,285 endogenous genes. D3 alone has four sample-tag features. I used the RNA counts to calculate the QC and doublet diagnostics in finding 1.1.
Where this evidence stops
Four tag features do not establish four mice or assign every cell to an animal. Missing identities prevent animal-level inference; they do not mean only one mouse was harvested. Empty-droplet background measurements remain unverified.
Publication Methods · No matching result plotHow cells were prepared and filtered
The Methods distinguish sample hashing, custom-reference alignment and dataset-specific filtering.
My input comparison
D3 tag features and retained construct features agree with the reported input preparation. The SS comparator belongs to this same CD146-selected series.
Where this evidence stops
Input correspondence does not reproduce demultiplexing, establish biological replication or justify tuning filters to match the authors’ final cell count.
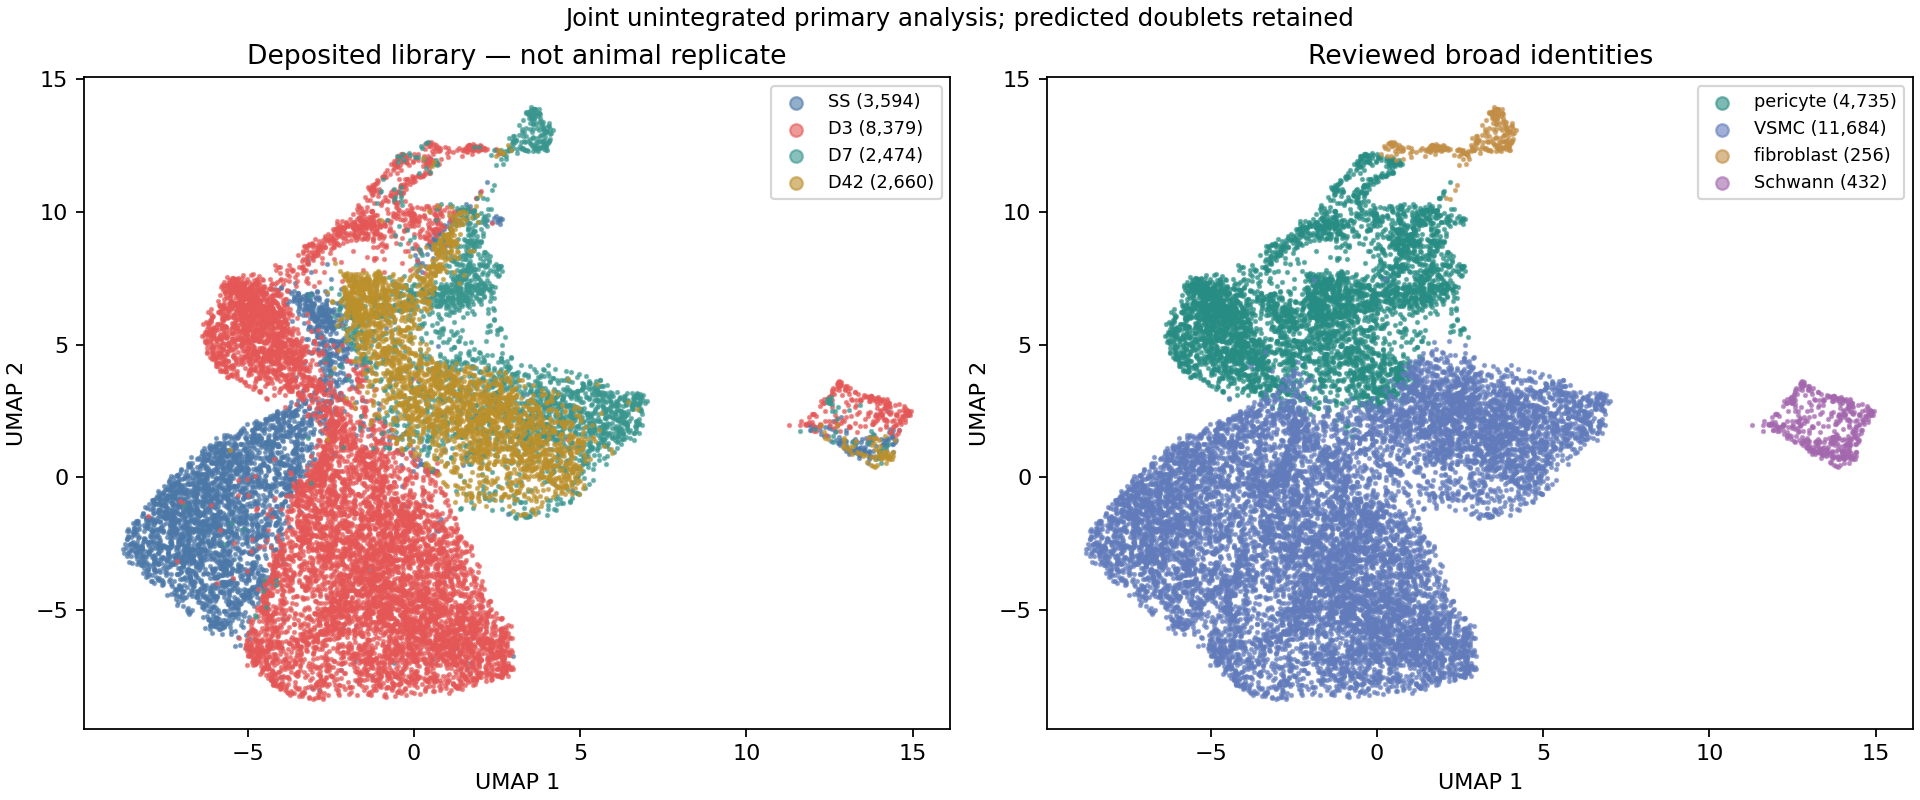
Pericytes support capillaries; VSMC means vascular smooth muscle cells. Schwann cells support nerves; fibroblasts are matrix-producing stromal cells. The embedding arranges similar expression profiles near each other. Its shapes and distances do not by themselves establish cell identity, lineage or separate biological states.
What this answers
Reported primary broad-identity counts: VSMC: 11,684; pericyte: 4,735; Schwann: 432; fibroblast: 256. Confidence counts: supported: 17,107. The annotation protocol requires concordant markers and competing evidence, not cluster number or Mcam alone.
Where this evidence stops
A supported broad cluster label is not a purity guarantee for every barcode. Selection and processing shape the observed population; no new activated-pericyte classifier is claimed.
My analysisConcordant and competing identity markers
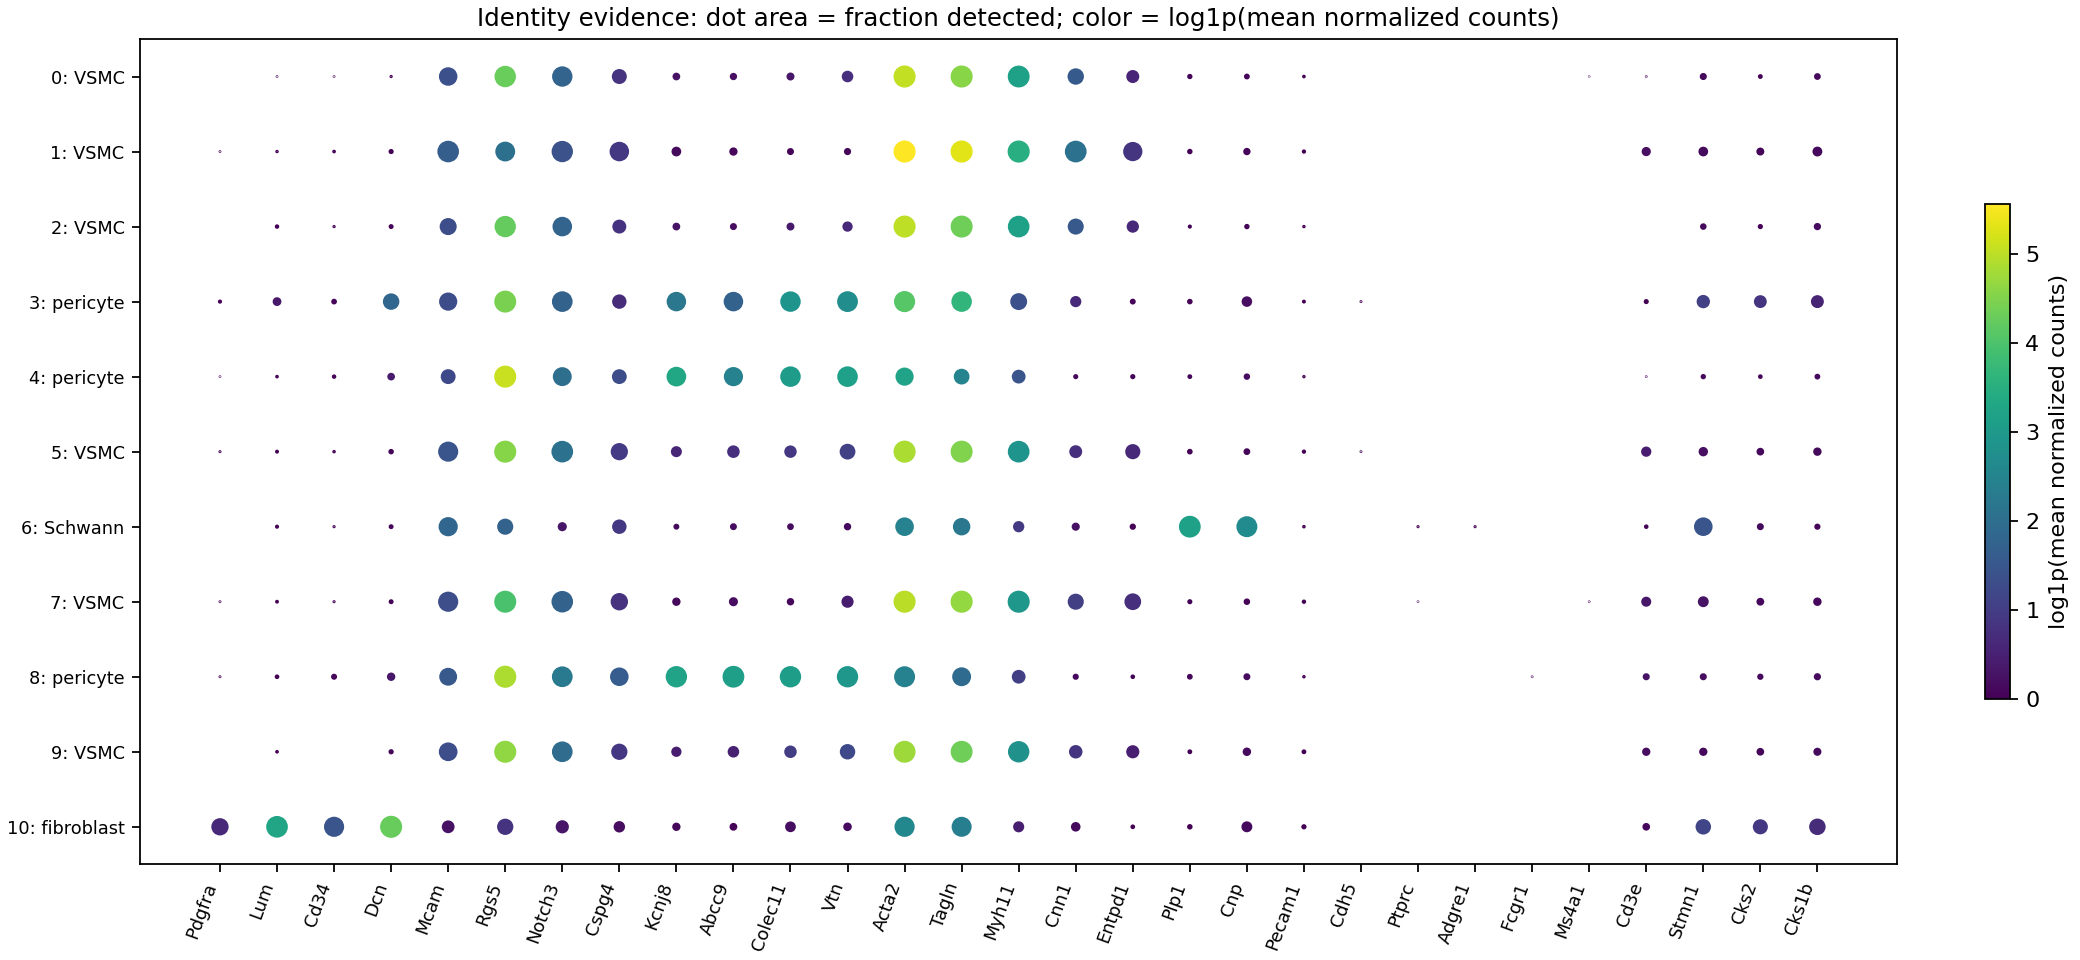
Read detection and expression together. A marker concentrated in a few cells is different from a concordant program across most of a cluster; follow the plotted legend for dot size and color.
What this answers
Kcnj8, Abcc9, Colec11 and Vtn support pericyte interpretation; Pdgfra with Lum/Dcn/Cd34 supports fibroblast interpretation, and Plp1/Cnp supports Schwann interpretation. Acta2/Tagln/Myh11 require additional mural context because contractile programs overlap.
Where this evidence stops
Absent Cspg4 or positive matrix/contractile genes do not automatically exclude pericytes. Dropout, ambient RNA and mixed cells remain competing explanations in the linked decisions.
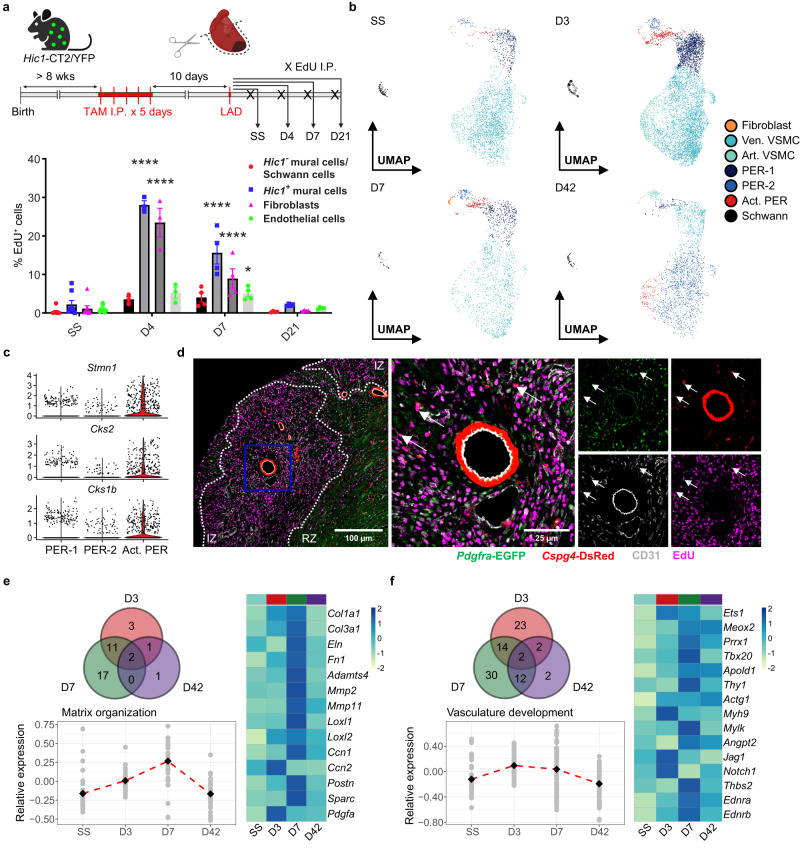
Publication reference · Not my resultTung Fig. 2b: the authors’ annotated series
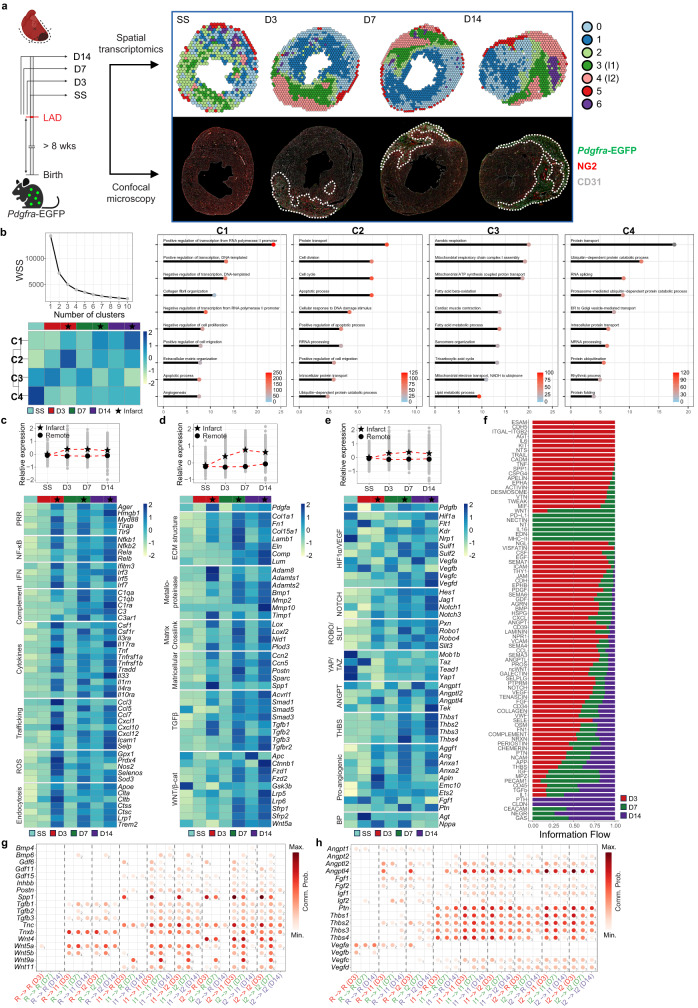
The authors use marker and other evidence to identify pericytes and an injury-associated subset. Supplementary Fig. 3c–d shows pericyte marker and shared program evidence.
Where this evidence stops
The authors used Seurat with integration; I used Scanpy without integration. I interpret cell identities through marker expression rather than similarity between UMAP shapes. The broad annotations shown here do not establish the authors’ activated-pericyte state.
Finding 2.2 · Recorded evidence
How consistently do cells retain their assigned identity?
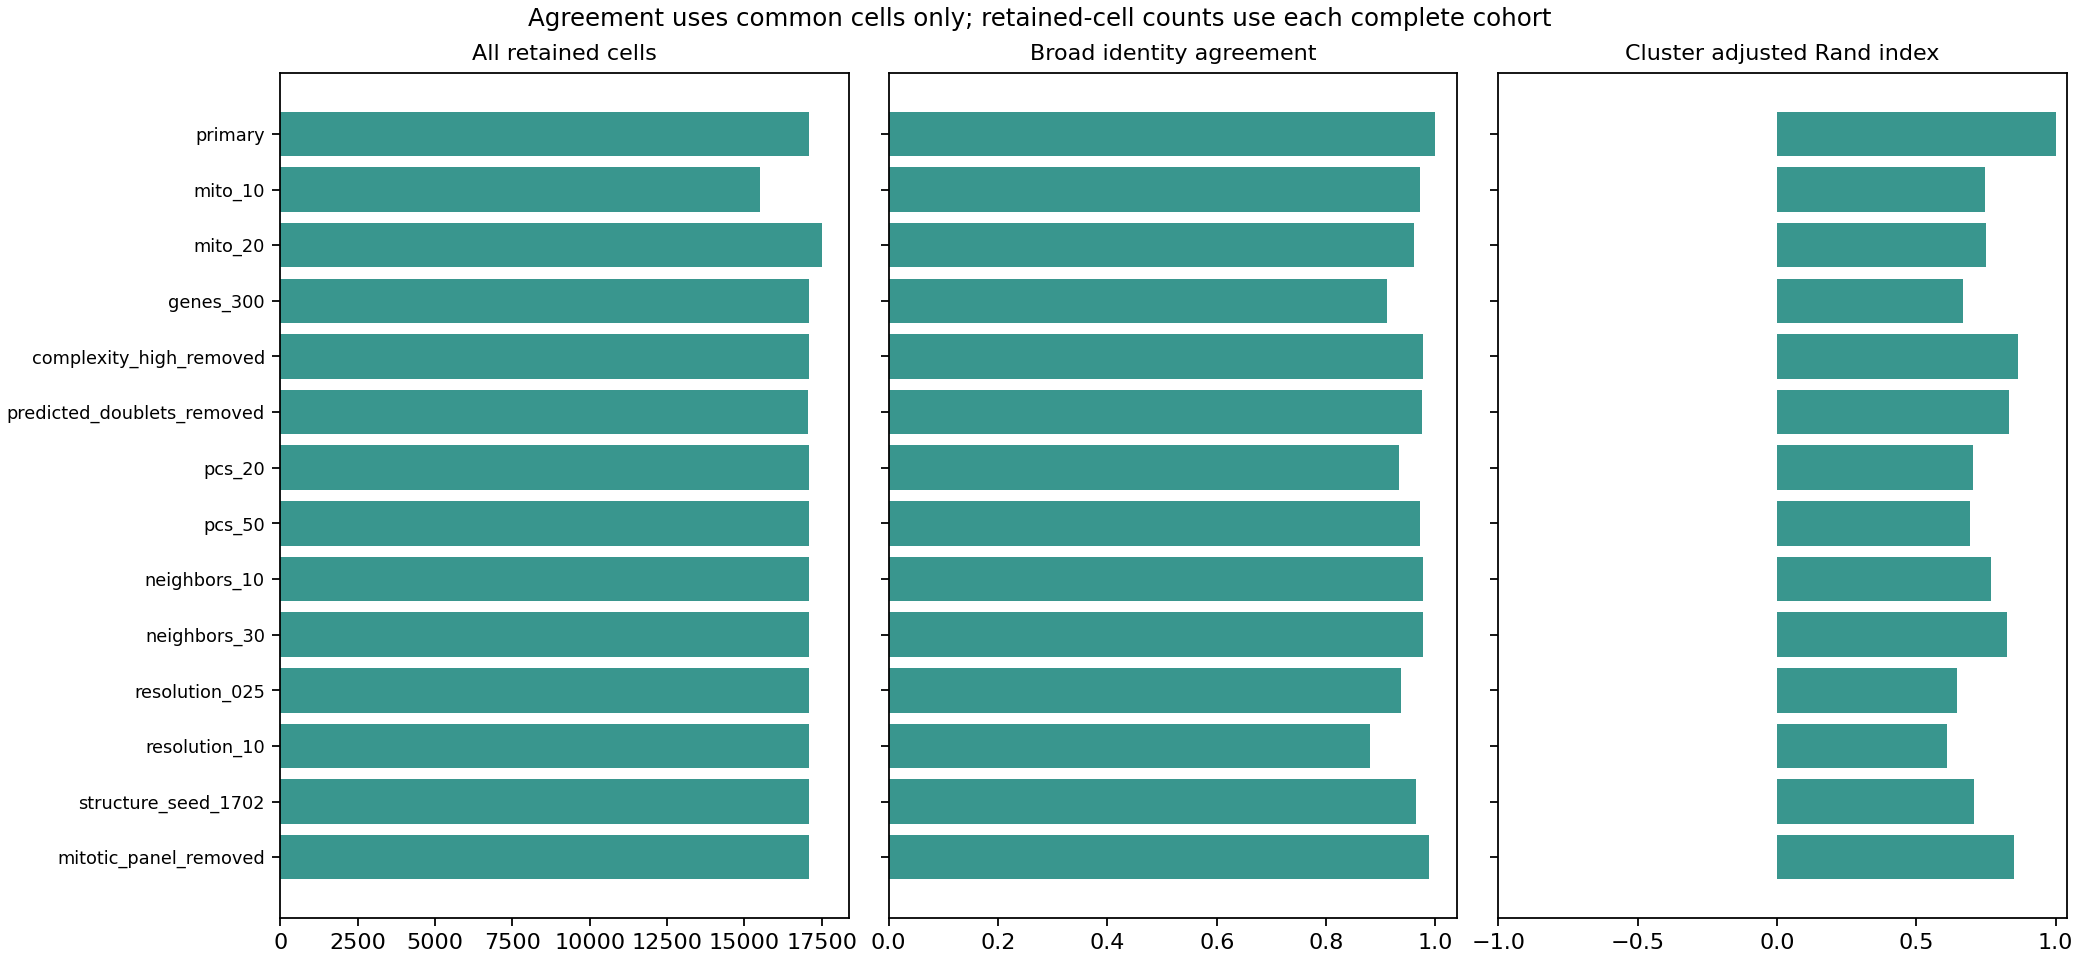
Broad-identity agreement compares names assigned to common cells. Adjusted Rand index compares cluster partitions, so the two measures answer different questions. Newly retained or excluded cells are reported separately.
What this answers
Across alternative analyses, 88.0% to 98.9% of cells present in both the primary and alternative analysis retain the same broad cell-type label. I compared 14 filtering and clustering configurations. The linked decisions preserve uncertain and mixed clusters as unassigned for composition.
Where this evidence stops
Stable labels can still be wrong. A cluster containing two cell types differs from cells expressing both programs. Excluding three cell-division genes tests only a limited part of cell-cycle influence.
Publication Methods · No matching result plotA new sensitivity audit, not a matching source panel
The source Methods describe variable-gene selection, integration, clustering and marker-informed grouping.
How my analysis differs
My prespecified alternatives test the dependence of clustering and annotation on QC, graph and limited mitotic-panel choices. Every variant is retained, including unfavorable or unresolved cases.
Where this evidence stops
There is no matching publication plot for this 14-variant audit. It is an extension, not reproduced robustness or independent biological confirmation.
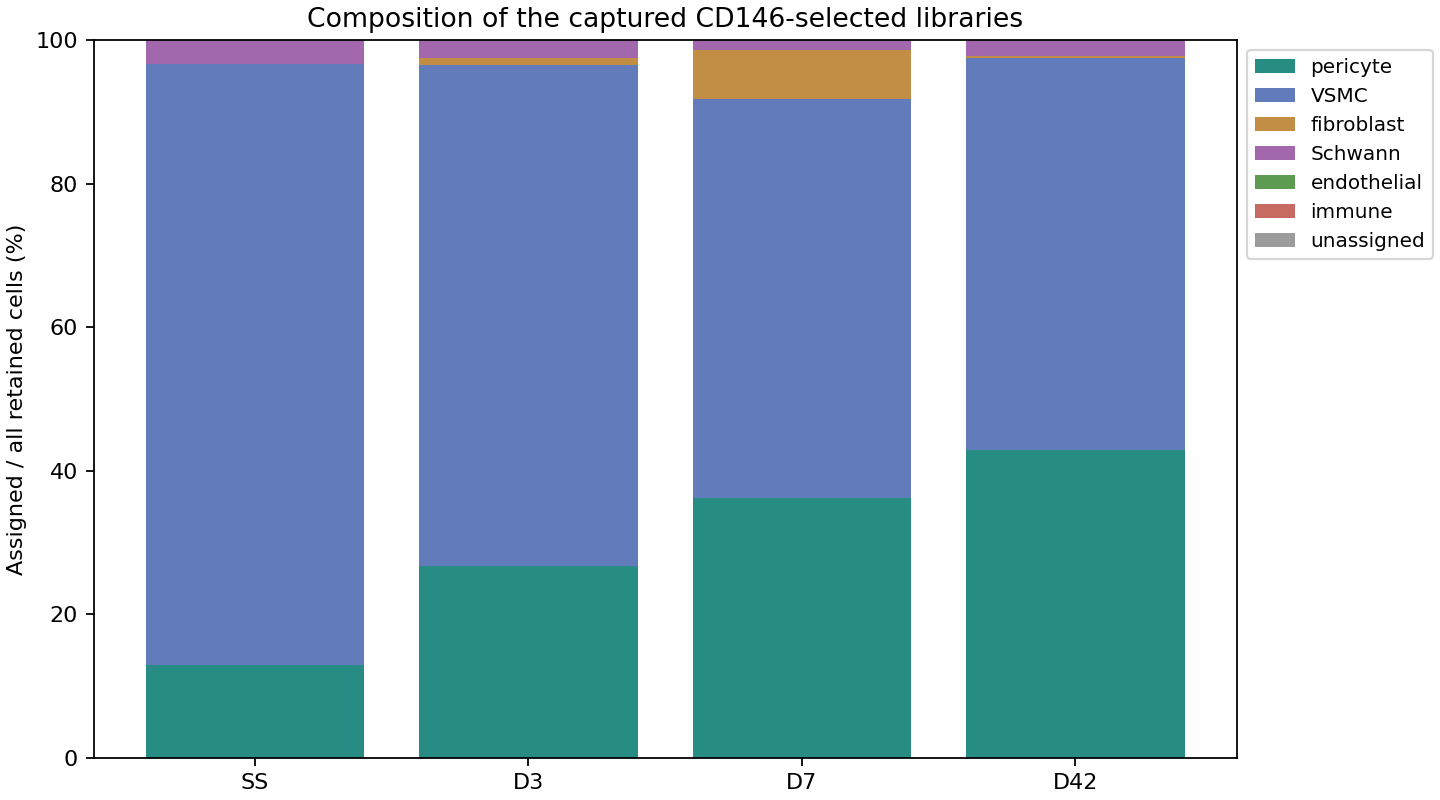
Each library has its own retained-cell denominator. A larger fraction means a larger share of this selected sample—not automatically more cells in the heart.
What this answers
Broad pericytes among all retained cells: SS: 466/3,594 (13.0%); D3: 2,234/8,379 (26.7%); D7: 894/2,474 (36.1%); D42: 1,141/2,660 (42.9%). These are captured-library fractions, not tissue abundance. The table records every broad identity and percentage-point differences against SS. Uncertain or mixed annotations remain unassigned. Exact numerators and denominators.
Where this evidence stops
Dissociation, CD146 selection, filtering and annotation affect representation. These are not activated-pericyte fractions, replicated animal estimates or evidence of absolute tissue expansion.
Publication reference · Not my resultTung Fig. 2b: source populations by time
The authors identify an injury-associated pericyte subset in their integrated series.
Where this evidence stops
A scatterplot’s density is not a test of tissue abundance. The authors’ activated-state fraction and my broad-pericyte fraction are different quantities and cannot be compared as interchangeable estimates.
Finding 3.2 · Recorded evidence
Expression differences and their sensitivity to clustering.
My analysisSupported pericytes: injury time versus SS
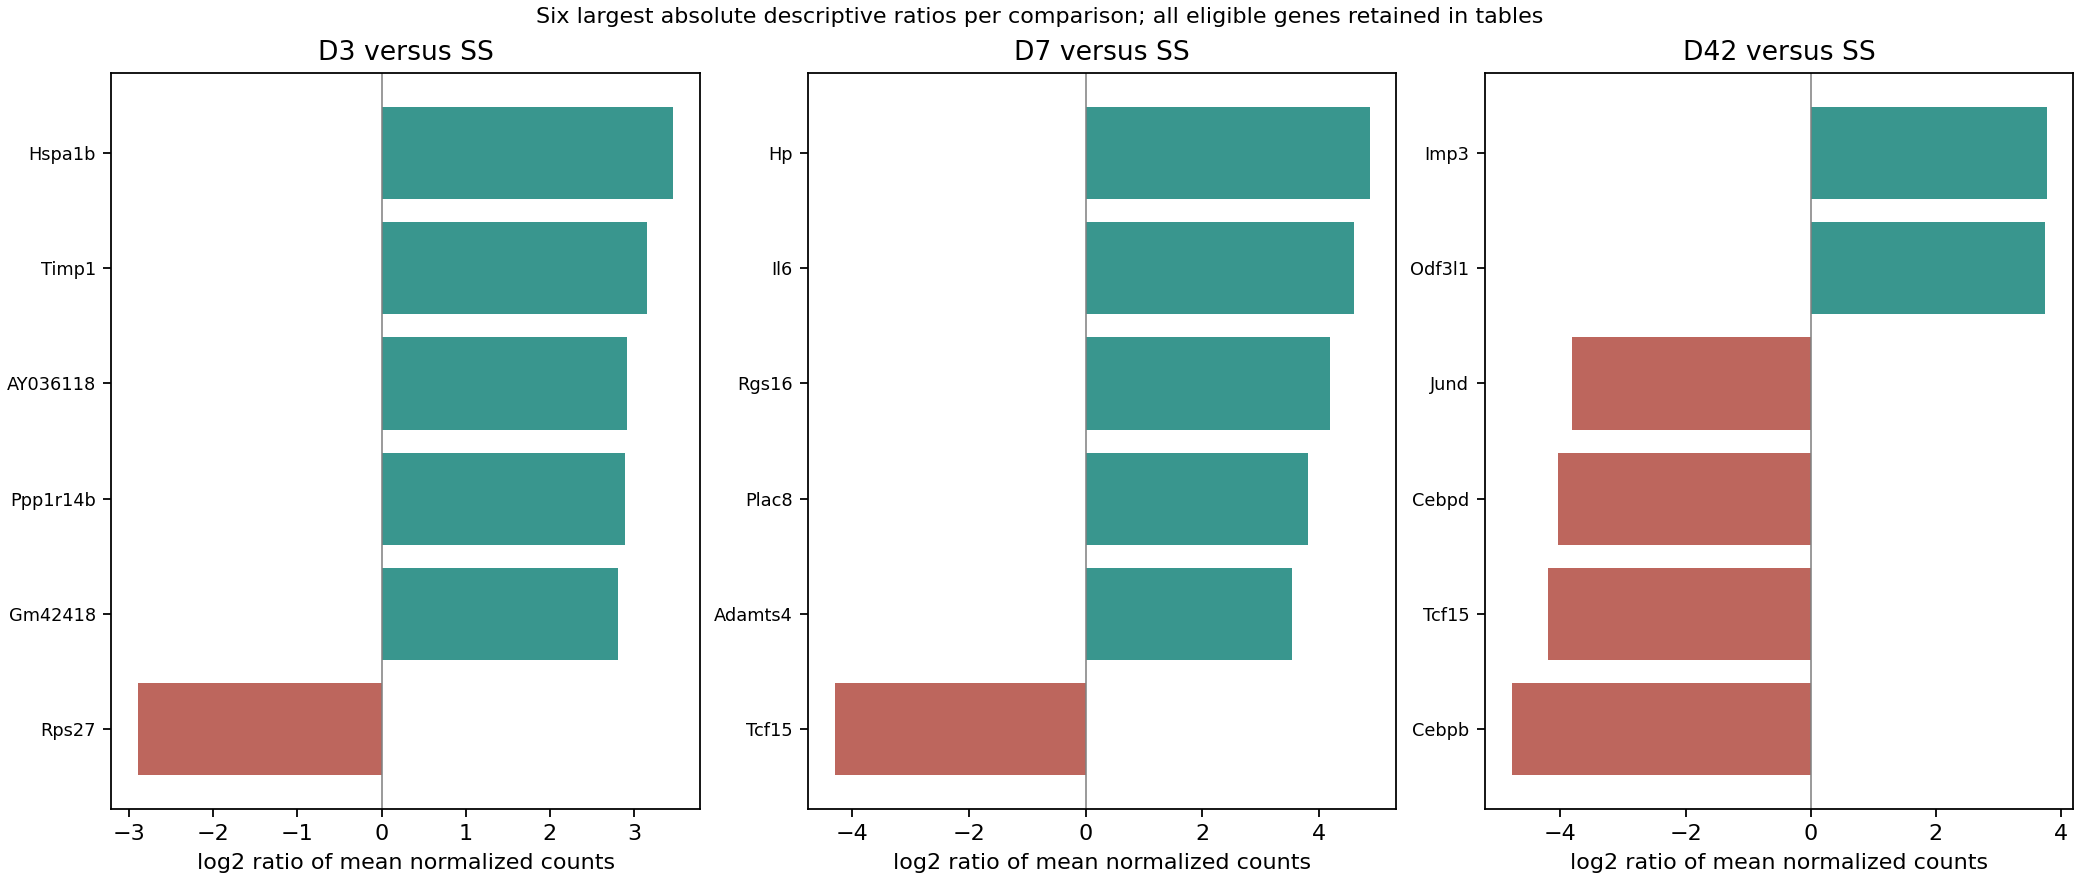
Each panel displays the six largest absolute descriptive ratios, not the Col1a1 example below. Bars are log2 ratios of mean normalized counts; group sizes and eligibility remain in the linked status table. Each comparison uses that variant’s supported broad pericytes.
What this answers
At D7, Col1a1 has mean normalized counts 7.73 versus 1.702 at SS; detection is 59.6% versus 25.3%, with a descriptive log2 ratio of 2.119. Some expression differences depend on clustering. For Nrip2 at D42, the log2 ratio relative to SS changes from 1.6623 in the primary analysis to -1.2139 with an alternative clustering seed (1702). Example gene values.
Where this evidence stops
The frozen log2 mean ratio uses a 0.1 pseudocount in normalized-count units. Small means can produce large ratios. A pooled difference can reflect changing state proportions, changes within states, or both; time–processing ambiguity also remains. Across the reported assessable variant/contrast slots, effect-direction agreement on common eligible genes ranges from 87.6% to 97.4%. Each variant uses its own reviewed pericytes; this is not common-cell refitting or an animal-level significance test. Effect-direction and magnitude sensitivities.
Publication reference · Not my resultTung Fig. 2e–f: all-pericyte temporal programs
The paper reports changes in matrix-associated and vascular-function gene expression after injury.
Where this evidence stops
These panels are not the activated-subset-versus-other-pericyte comparison in panel c or Supplementary Fig. 3d. My descriptive thresholds, processing and identities differ from the authors’ Wilcoxon analysis.
Finding 3.1. My fractions describe independently annotated broad groups within retained CD146 libraries, not the source activated-subset frequency.
Finding 3.2. Related biological question, different processing and estimand details; no exact DE reproduction or animal-level confirmation is claimed. Recorded contrast status: D3_vs_SS: descriptive, 2,234 injury versus 466 SS cells, 7,224 eligible genes; D42_vs_SS: descriptive, 1,141 injury versus 466 SS cells, 4,414 eligible genes; D7_vs_SS: descriptive, 894 injury versus 466 SS cells, 5,427 eligible genes.
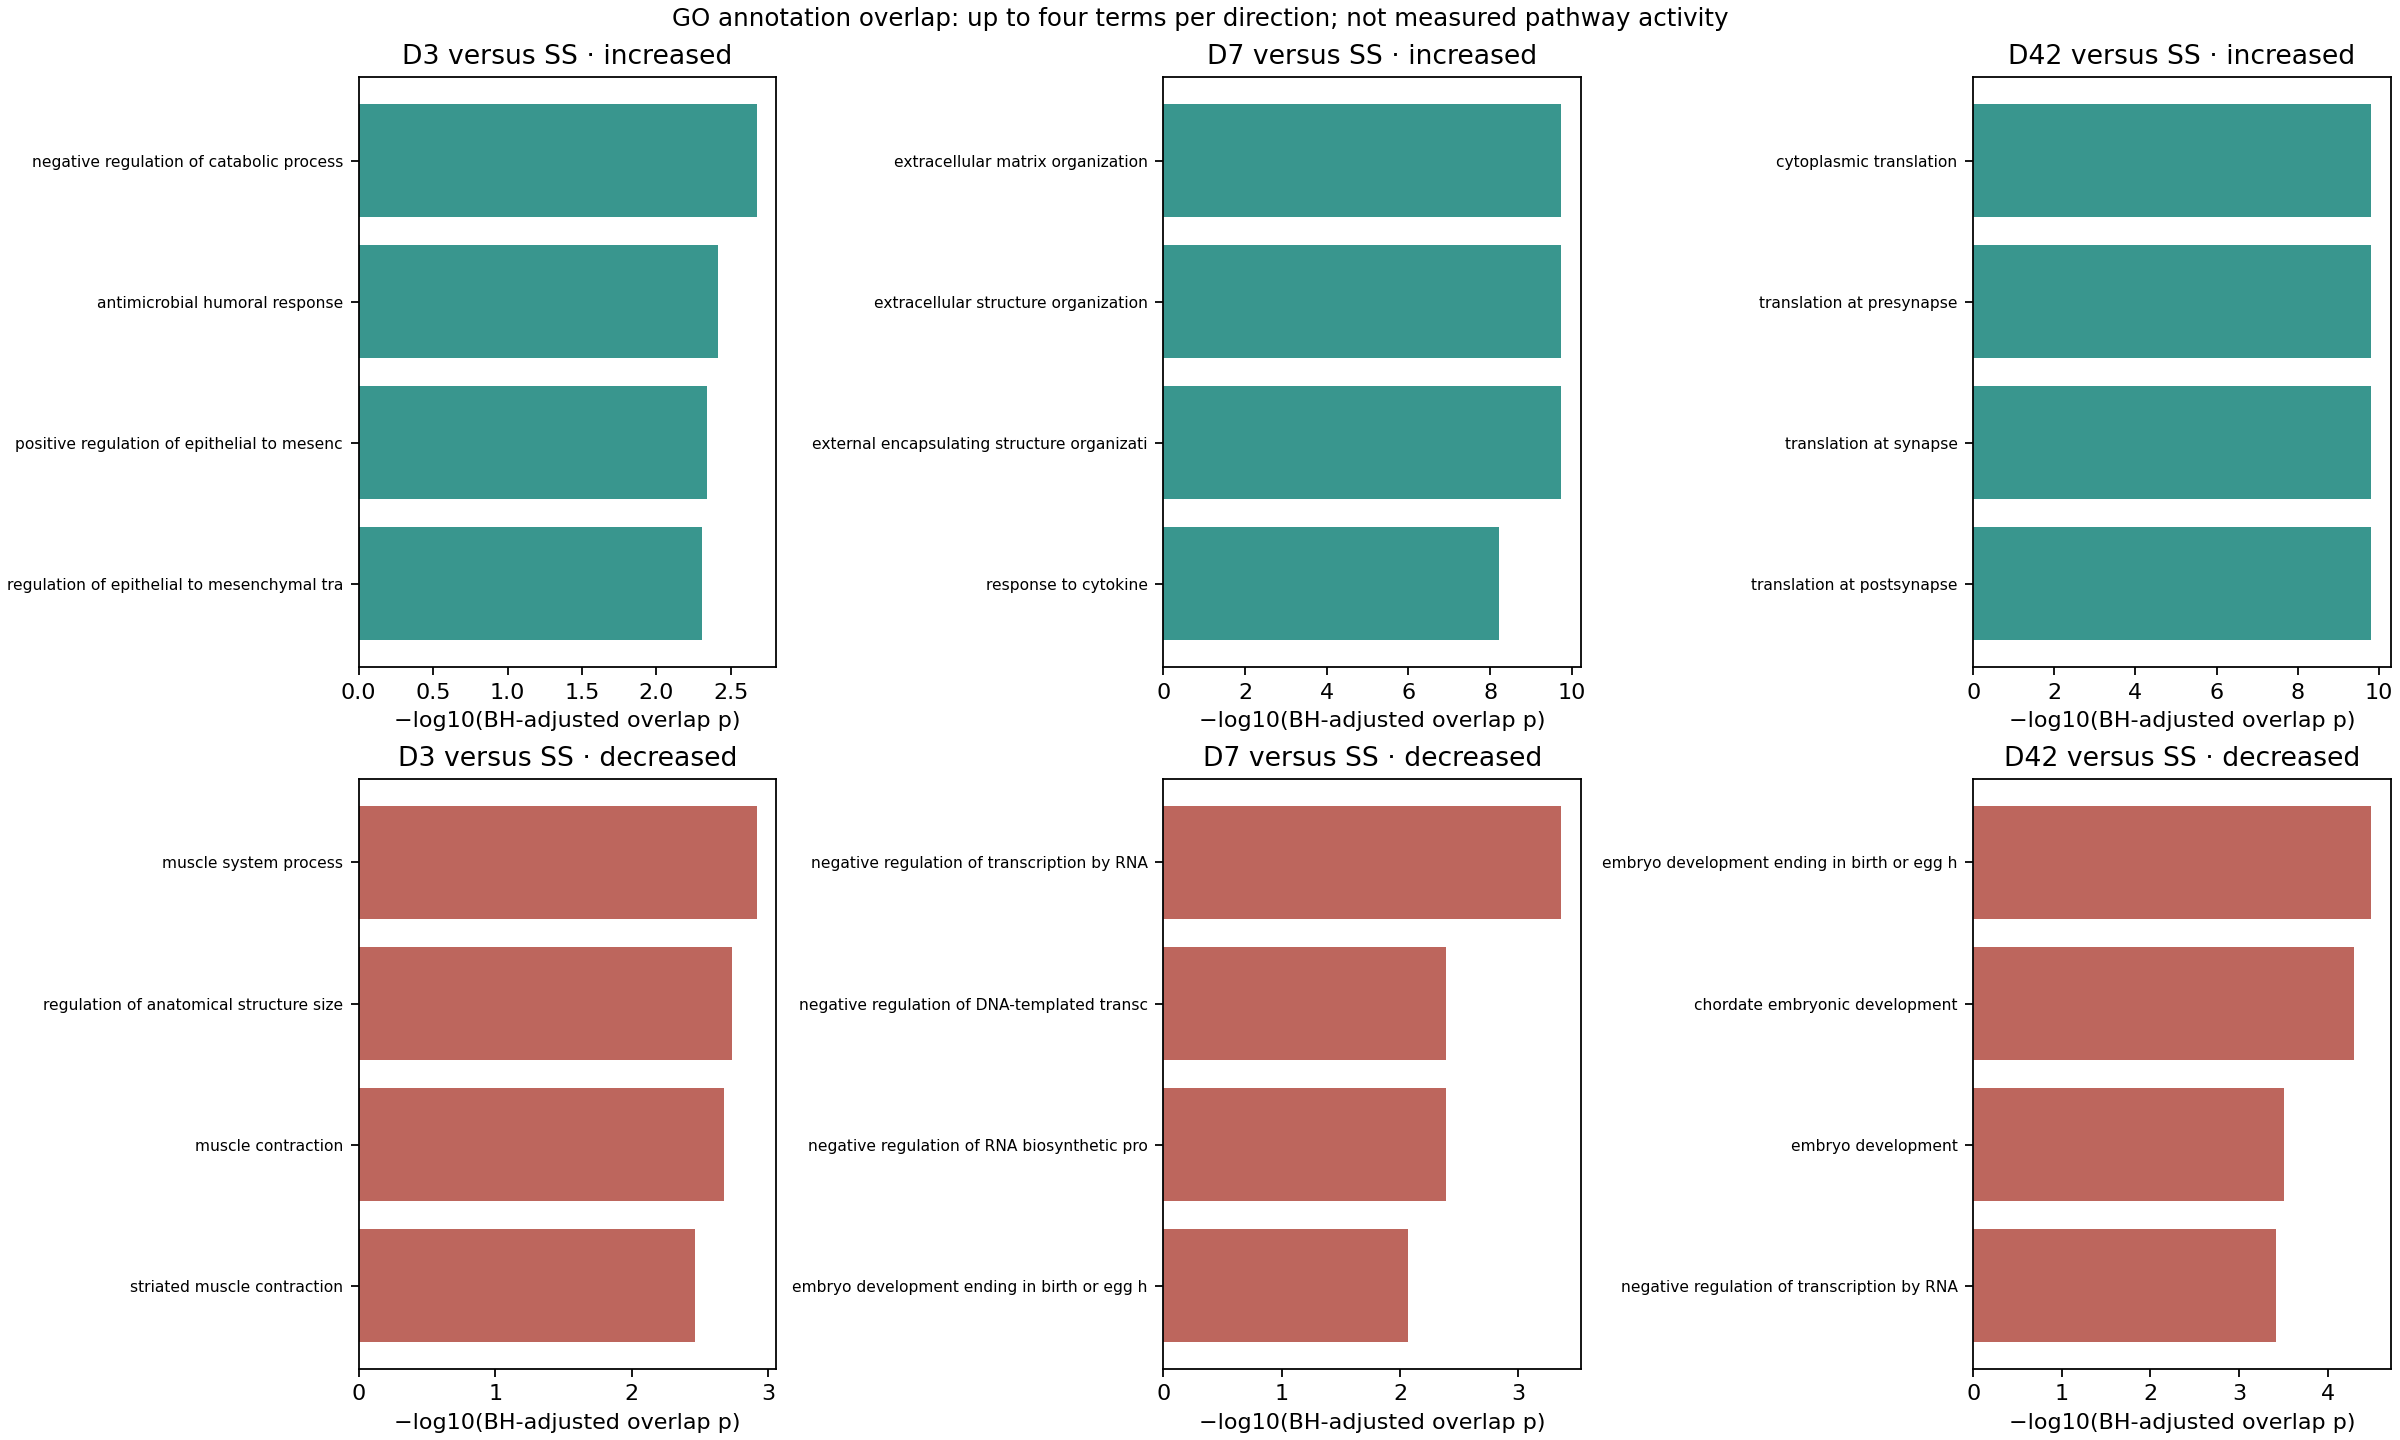
Gene Ontology associates genes with biological processes. Enrichment asks whether a term is more common in the selected list than in the eligible mapped background. Increased and decreased lists are tested separately. Bars show −log10 of the adjusted overlap probability: longer bars mean smaller adjusted probabilities, not greater pathway activity.
What this answers
Genes with lower expression at D3 relative to SS are enriched for muscle system process. Genes with higher expression at D7 relative to SS are enriched for extracellular matrix organization. Genes with higher expression at D42 relative to SS are enriched for cytoplasmic translation.
Full displayed term names and IDs
Comparison / direction
Term
D3_vs_SS / increased
GO:0009895: negative regulation of catabolic process
D3_vs_SS / increased
GO:0019730: antimicrobial humoral response
D3_vs_SS / increased
GO:0010718: positive regulation of epithelial to mesenchymal transition
D3_vs_SS / increased
GO:0010717: regulation of epithelial to mesenchymal transition
D3_vs_SS / decreased
GO:0003012: muscle system process
D3_vs_SS / decreased
GO:0090066: regulation of anatomical structure size
The leading D7 matrix/structure terms reuse contributors; they are not independent confirmations. Synapse-named translation terms overlap ribosomal annotations, not evidence of neuronal identity or synapse formation. D3 epithelial-to-mesenchymal-transition annotations do not demonstrate lineage conversion. Genes enter the list when their descriptive expression ratio meets the fixed twofold threshold. Enrichment identifies associated annotations; it does not measure pathway activity. An unassessable comparison cannot be interpreted as an absence of enrichment.
Publication Methods · No matching result plotEnrichment and expression summaries are different outputs
The Methods distinguish DAVID GO Direct enrichment from averaging expression of genes associated with selected GO terms.
What the authors report
Fig. 2e–f displays GO-associated temporal expression. Fig. 5b contains enrichment plots for a different spatial gene-list question; it is not a direct counterpart of my single-cell enrichment plot.
Where this evidence stops
My retained GO/MGI resources and explicit backgrounds differ from the authors’ 2023 DAVID resources. This is a versioned functional characterization, not exact recovery of the published enrichment table.
Finding 4.2 · Recorded evidence
Contributing genes explain what an enriched term means here.
My analysisGene measurements behind the GO summary
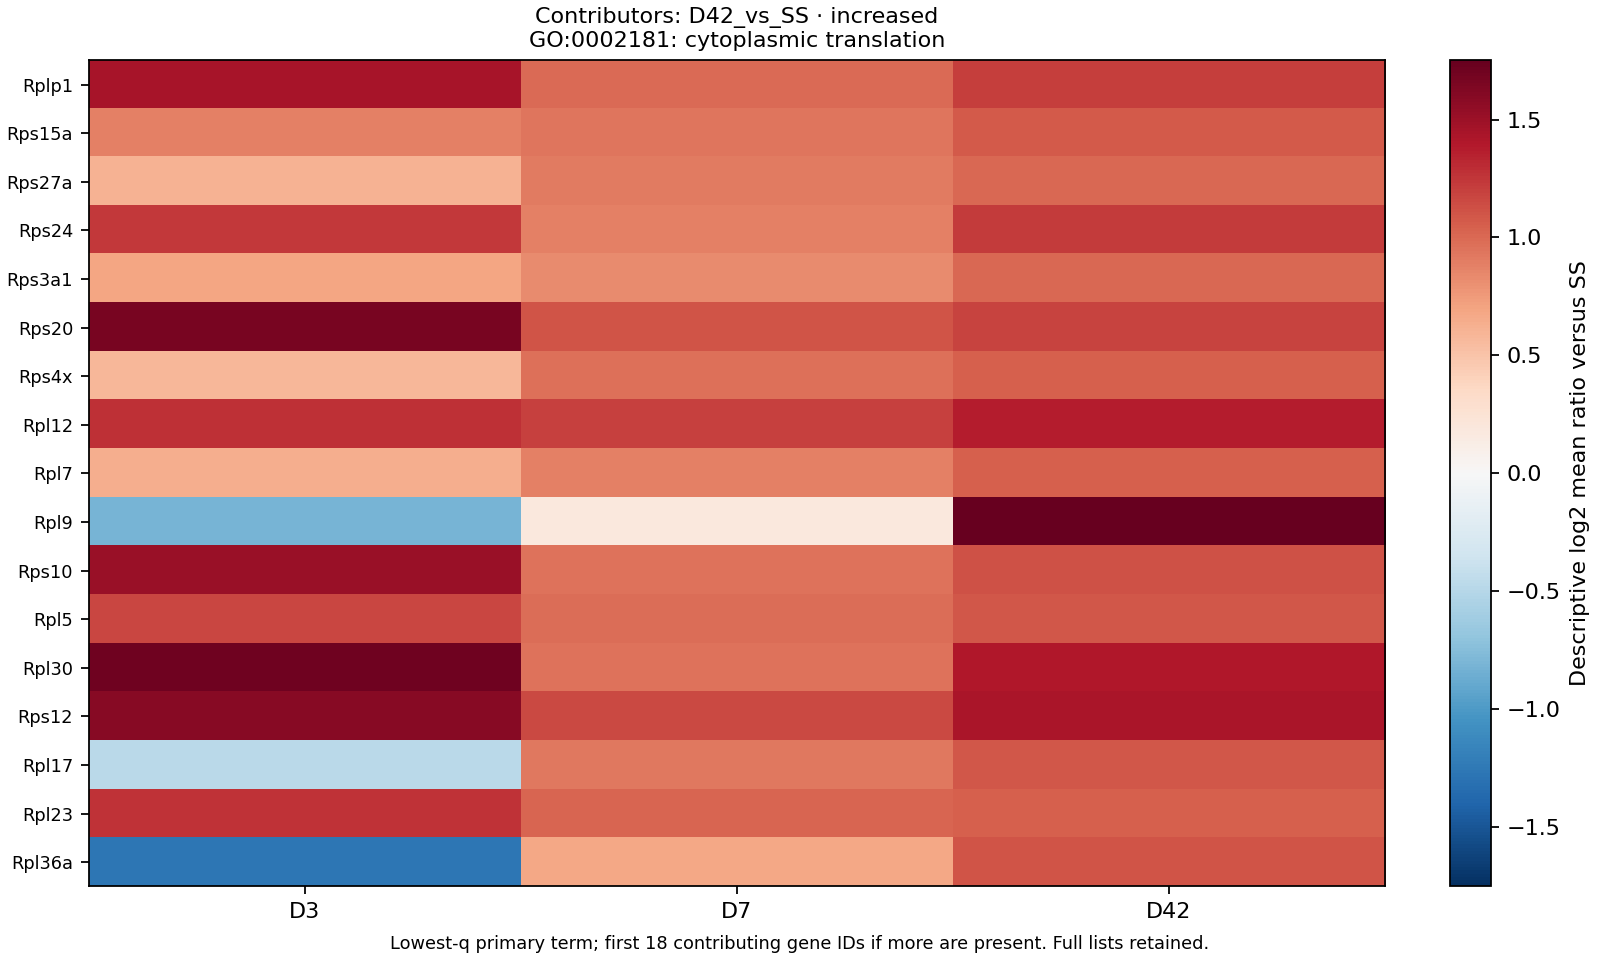
Rows are contributing genes; columns are D3, D7 and D42, each compared with SS. Colors show the descriptive log2 mean ratio: red is higher and blue lower than SS. The term is an annotation summary, not a measurement of protein production. Use the term and comparison named in the figure to find the corresponding rows in the contributor table.
What this answers
For the contributor figure’s selected term, cytoplasmic translation (GO:0002181; D42_vs_SS, increased), the selected-list overlap is 17/44 genes, versus 143/4,035 in the background. Adjusted overlap probability: 1.57e-10; enrichment ratio: 10.9.
Where this evidence stops
Related terms share genes, and some annotations describe upstream roles rather than direct participation. A term can hide differing gene-level effects. The example view is not a substitute for all contributors and the complete selected/background lists.
Publication reference · Not my resultTung Fig. 2e–f: genes behind matrix and vascular themes
The authors connect matrix and vascular themes to particular genes with different temporal expression patterns.
Where this evidence stops
Neither a scaled expression heatmap nor an enrichment statistic is a functional assay. My full gene and resource tables are needed to judge whether a similar term rests on similar evidence.
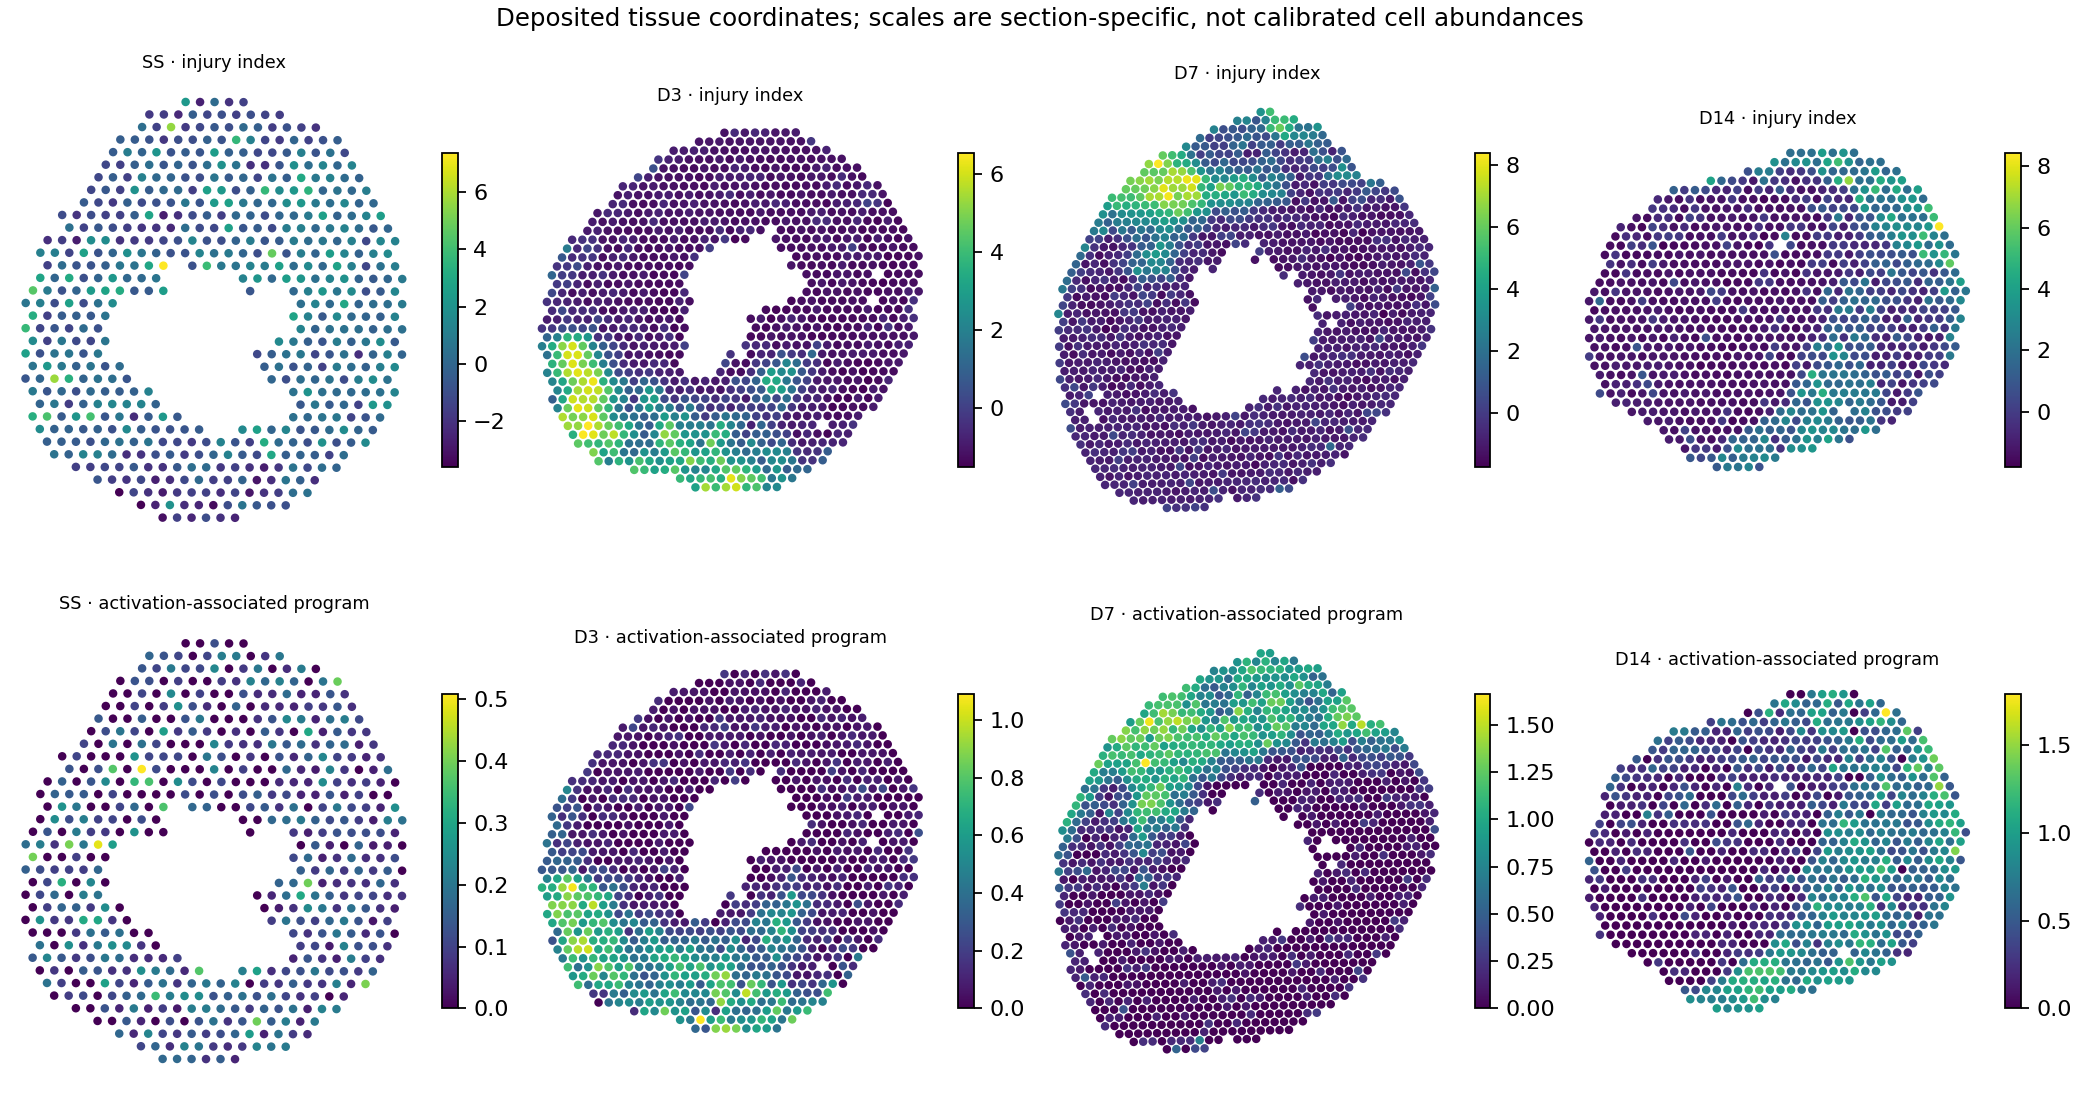
Each spot combines RNA from nearby cells. The injury index rises with injury-associated RNA and falls with heart-muscle RNA, standardized within that section. Check each map’s color scale and section label.
What this answers
The activation-associated score averages normalized log-expression of Loxl2, Postn, Timp1, Mmp14, Thy1, Ptn and Ecscr. The injury index uses separate injury-associated and heart-muscle genes. Their maps show where each RNA pattern is stronger within a section.
Where this evidence stops
The index is not an independently annotated infarct boundary, and the scores do not identify which cells produced the RNA. Coordinates provide location, not histological segmentation. SS/D3/D7 are the shared modality times; D14 is not D42.
Publication reference · Not my resultTung Fig. 5a: integrated spatial regions and complementary imaging
The authors distinguish infarct-associated from remote regional programs using integrated spot data and imaging context.
Where this evidence stops
My analysis compares RNA scores within each section. It does not estimate cell-type composition at each spot or reproduce the authors’ regional clustering and communication analysis.
Finding 5.2 · Recorded evidence
Does the RNA signature track molecular signs of injury?
My analysisContinuous molecular injury index versus activation-associated RNA
Each dot is one retained spatial spot. The horizontal axis is the continuous molecular injury index; the vertical axis is the activation-associated RNA score. D3 is primary. The companion text/table supplies median- and quartile-group differences and rank correlation; those group contrasts are not plotted as bars here. Moran’s I describes spatial similarity between neighboring spots.
What this answers
At day 3, the activation-associated RNA signature is stronger where the injury-related RNA index is higher. These measurements cannot identify the cells producing the signal.
The association may reflect changes in the mix of cells contributing RNA. It cannot establish accumulation of activated pericytes or a causal mechanism. D7 provides an additional descriptive comparison; SS and D14 provide uninjured and later context.
Publication reference · Not my resultTung Supplementary Fig. 5i: predicted cell-associated scores
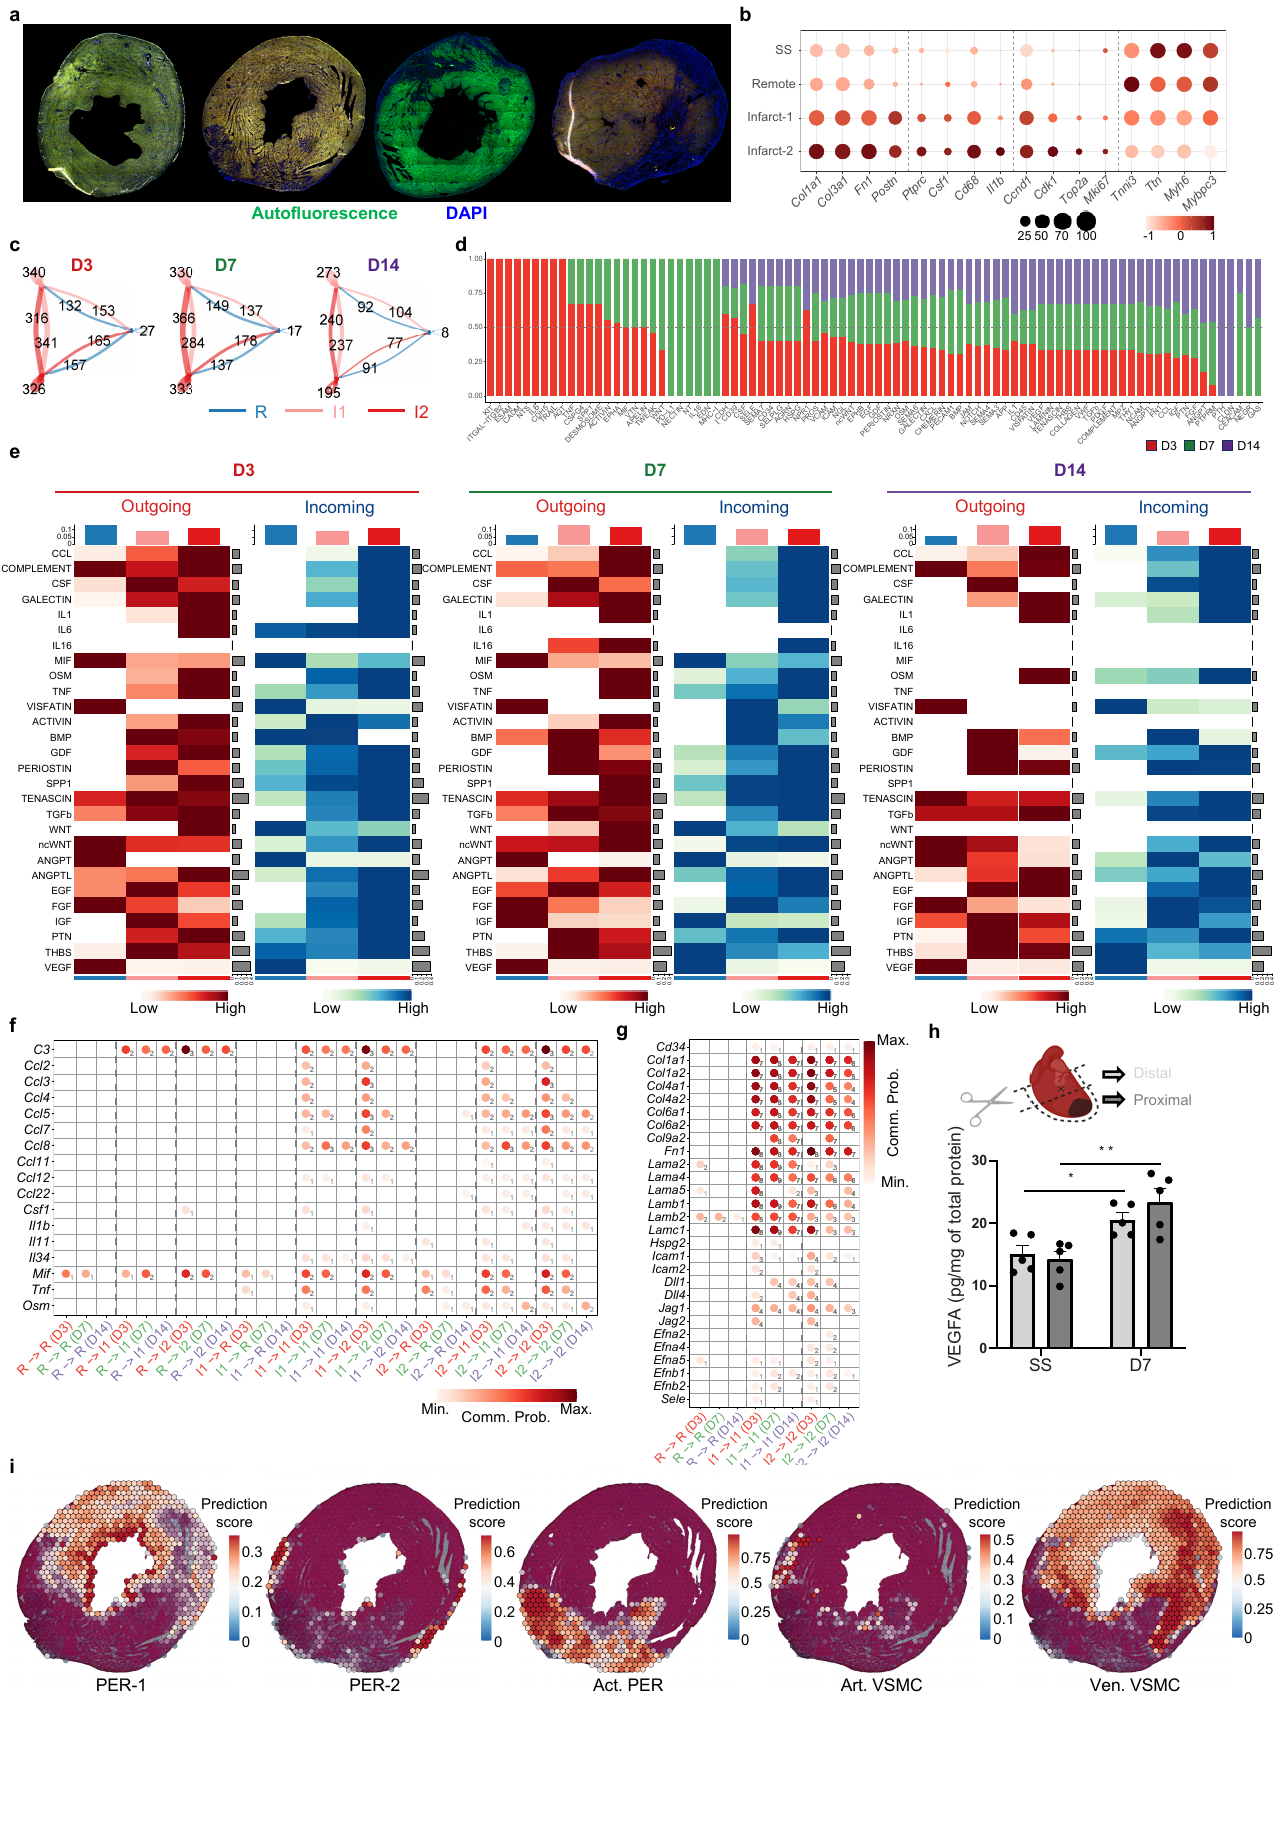
Panel i maps predicted cell-associated scores. The separate microscopy experiment in Fig. 2d examines EdU-positive pericytes in the injury region. These are different measurements.
What the authors report
The paper combines cell-division imaging with reference-based spatial predictions to support its biological interpretation.
Where this evidence stops
Prediction scores are not direct cell counts, and my fixed-panel proxy is neither that label-transfer model nor the microscopy experiment. Reusing the same study does not provide independent confirmation of cellular localization.
Finding 5.1. My fixed-panel spatial scores are a molecular proxy, not the paper’s histologically informed regional assignments.
Finding 5.2. I retained the earlier project’s gene sets and scoring rules. The observed RNA association leaves the location of activated pericytes unresolved.