Vessel-associated cell states: patterns, uncertainty and robustness
Scientific limitations are retained beside the findings.
I examine whether pericyte-like cells and vascular smooth muscle cells (VSMCs) contain clusters with distinguishable RNA patterns after myocardial infarction. I compare their gene expression, assess how confidently each cluster can be interpreted, and examine how analysis choices affect cell assignments.
What I ask
How I investigate it
Evidence
Which RNA patterns distinguish cell clusters?
Compare multiple marker genes across clusters and show how the clusters are represented at each sampled time.
Assess marker support and competing explanations, including mixed identity, stress responses and RNA-content differences. Keep uncertain assignments visible.
How much do assignments depend on analysis choices?
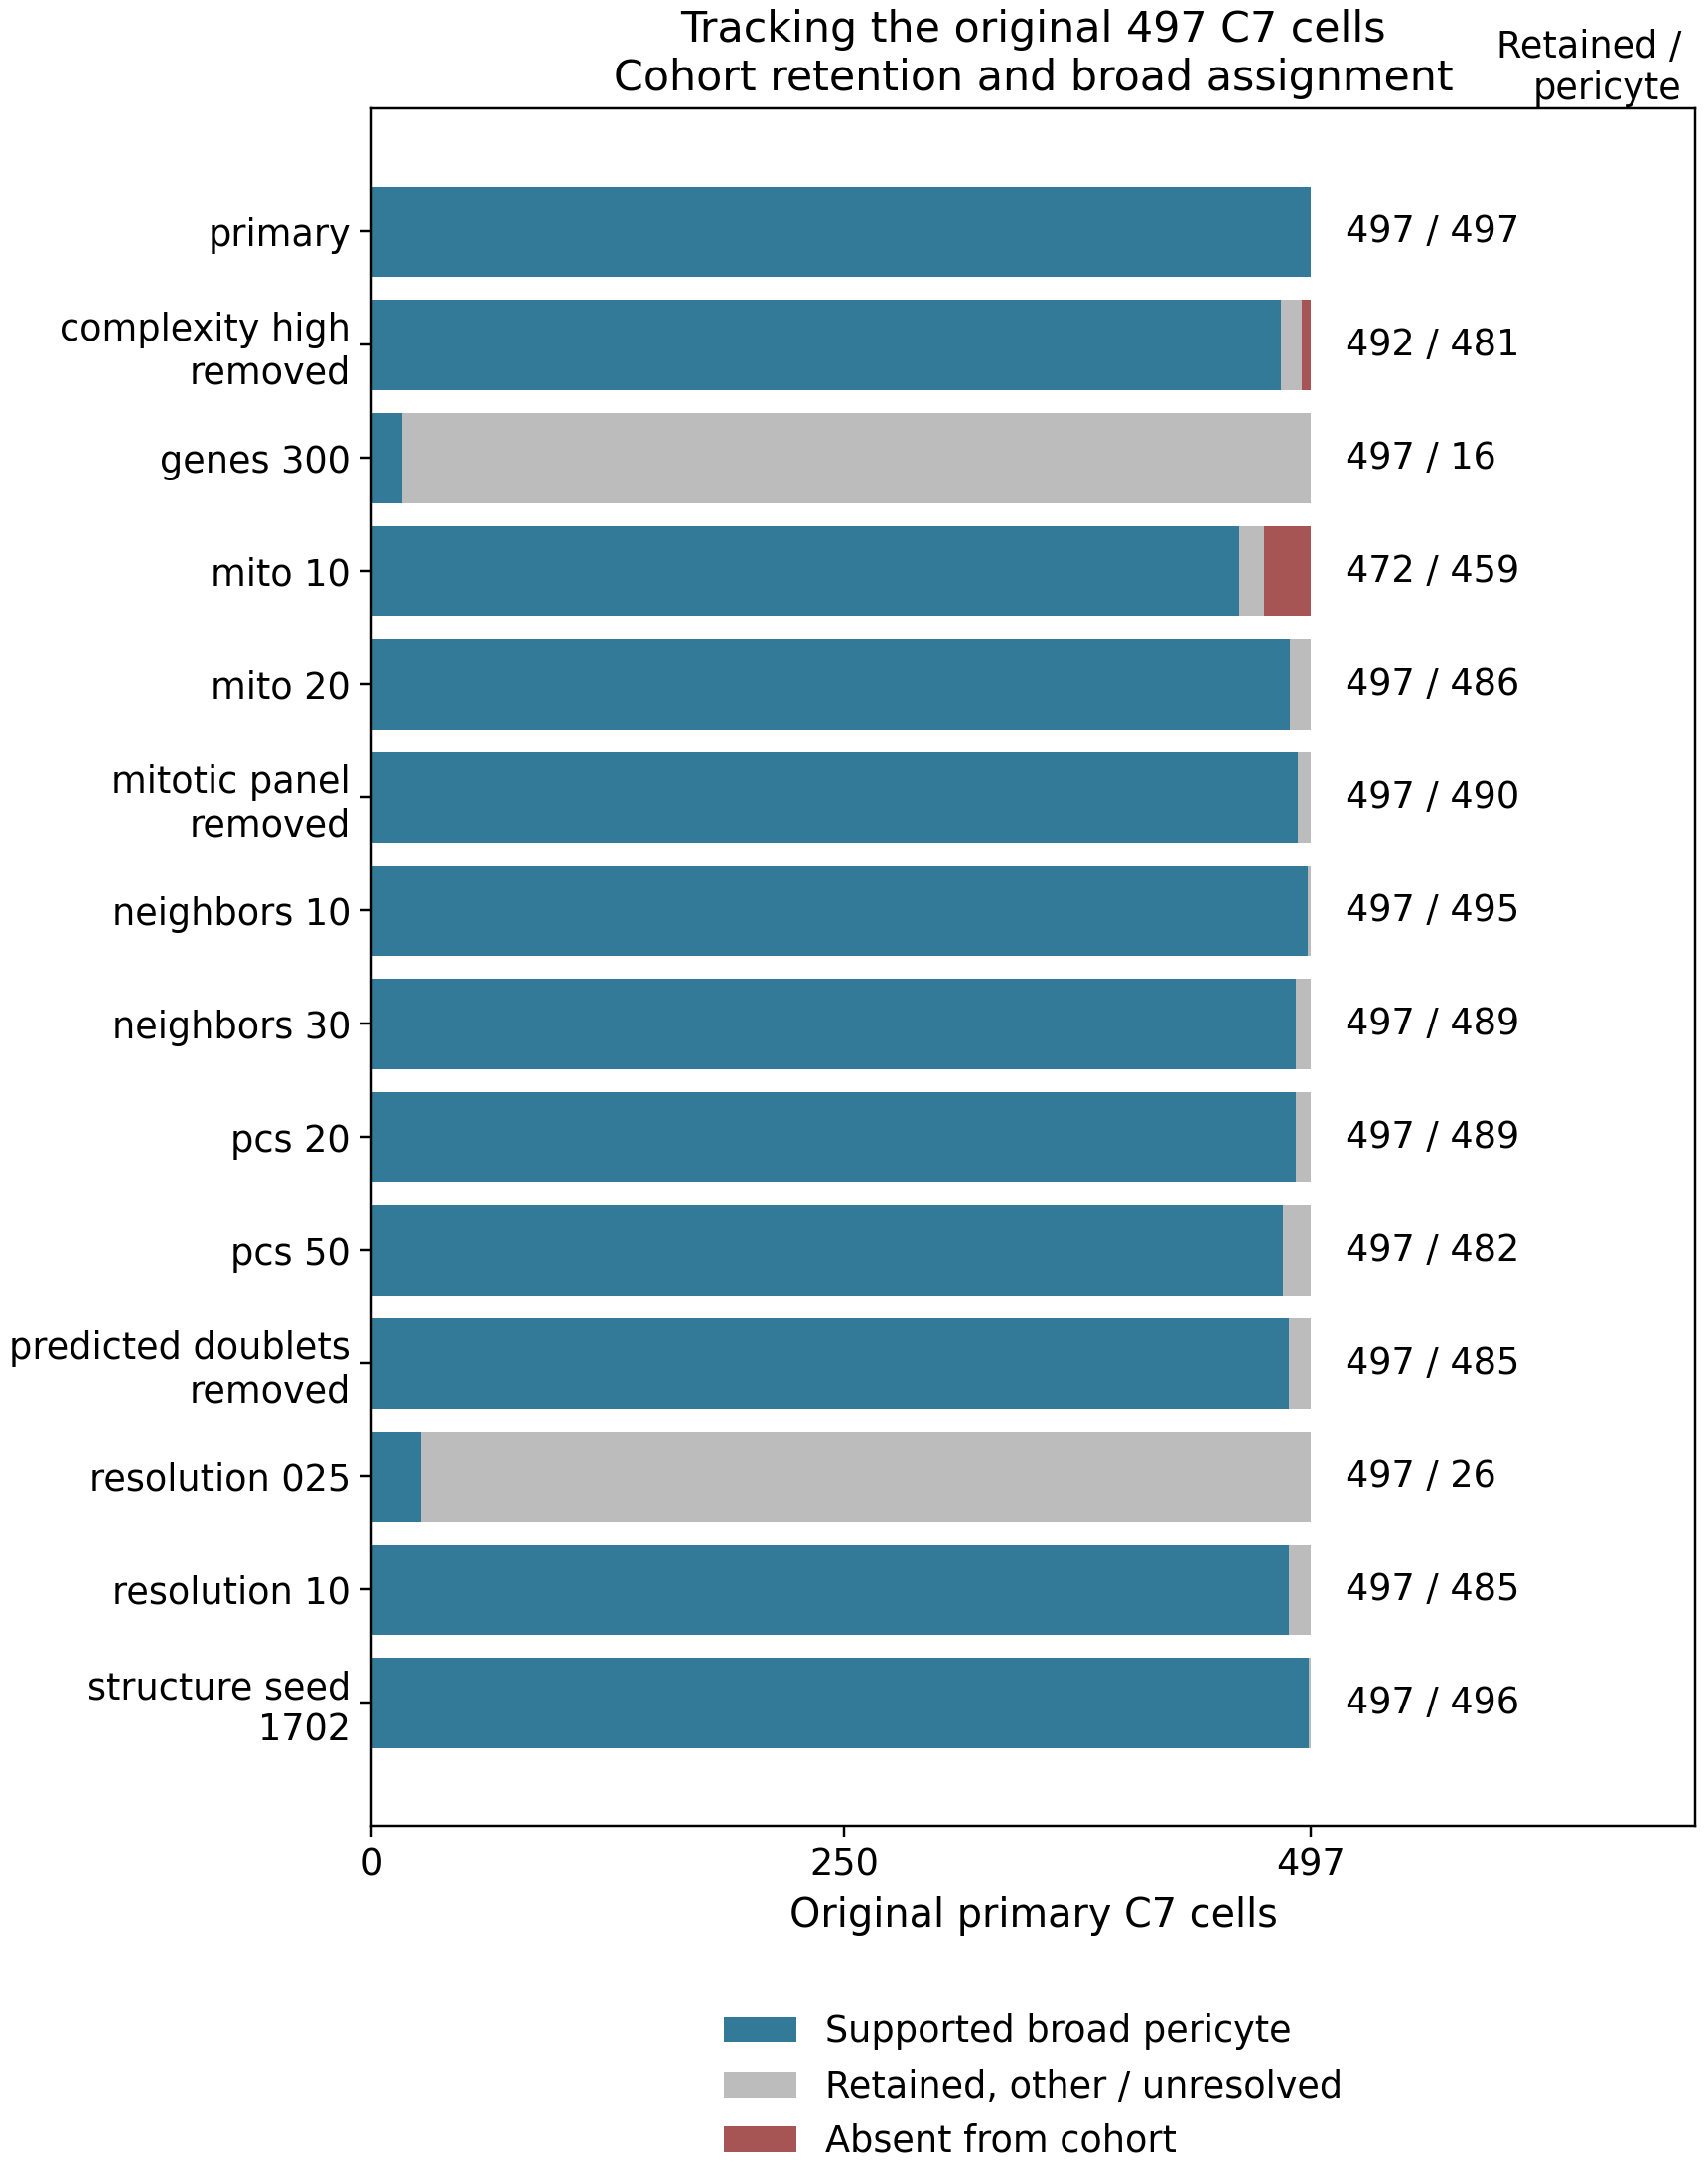
Follow the same 497 C7 cells through alternative filtering and clustering analyses. Their broad pericyte assignments change substantially even though all remain in the retained data under two alternatives.
C3 or C7 identifies a cluster in my reanalysis, not a cluster from the paper. SS means uninjured steady state; D3, D7 and D42 mean days after infarction. The deposited series lacks recoverable cell-to-mouse identities across all times, so I cannot estimate how consistently these patterns recur across mice.
Which RNA patterns can I distinguish within pericyte-like cells?
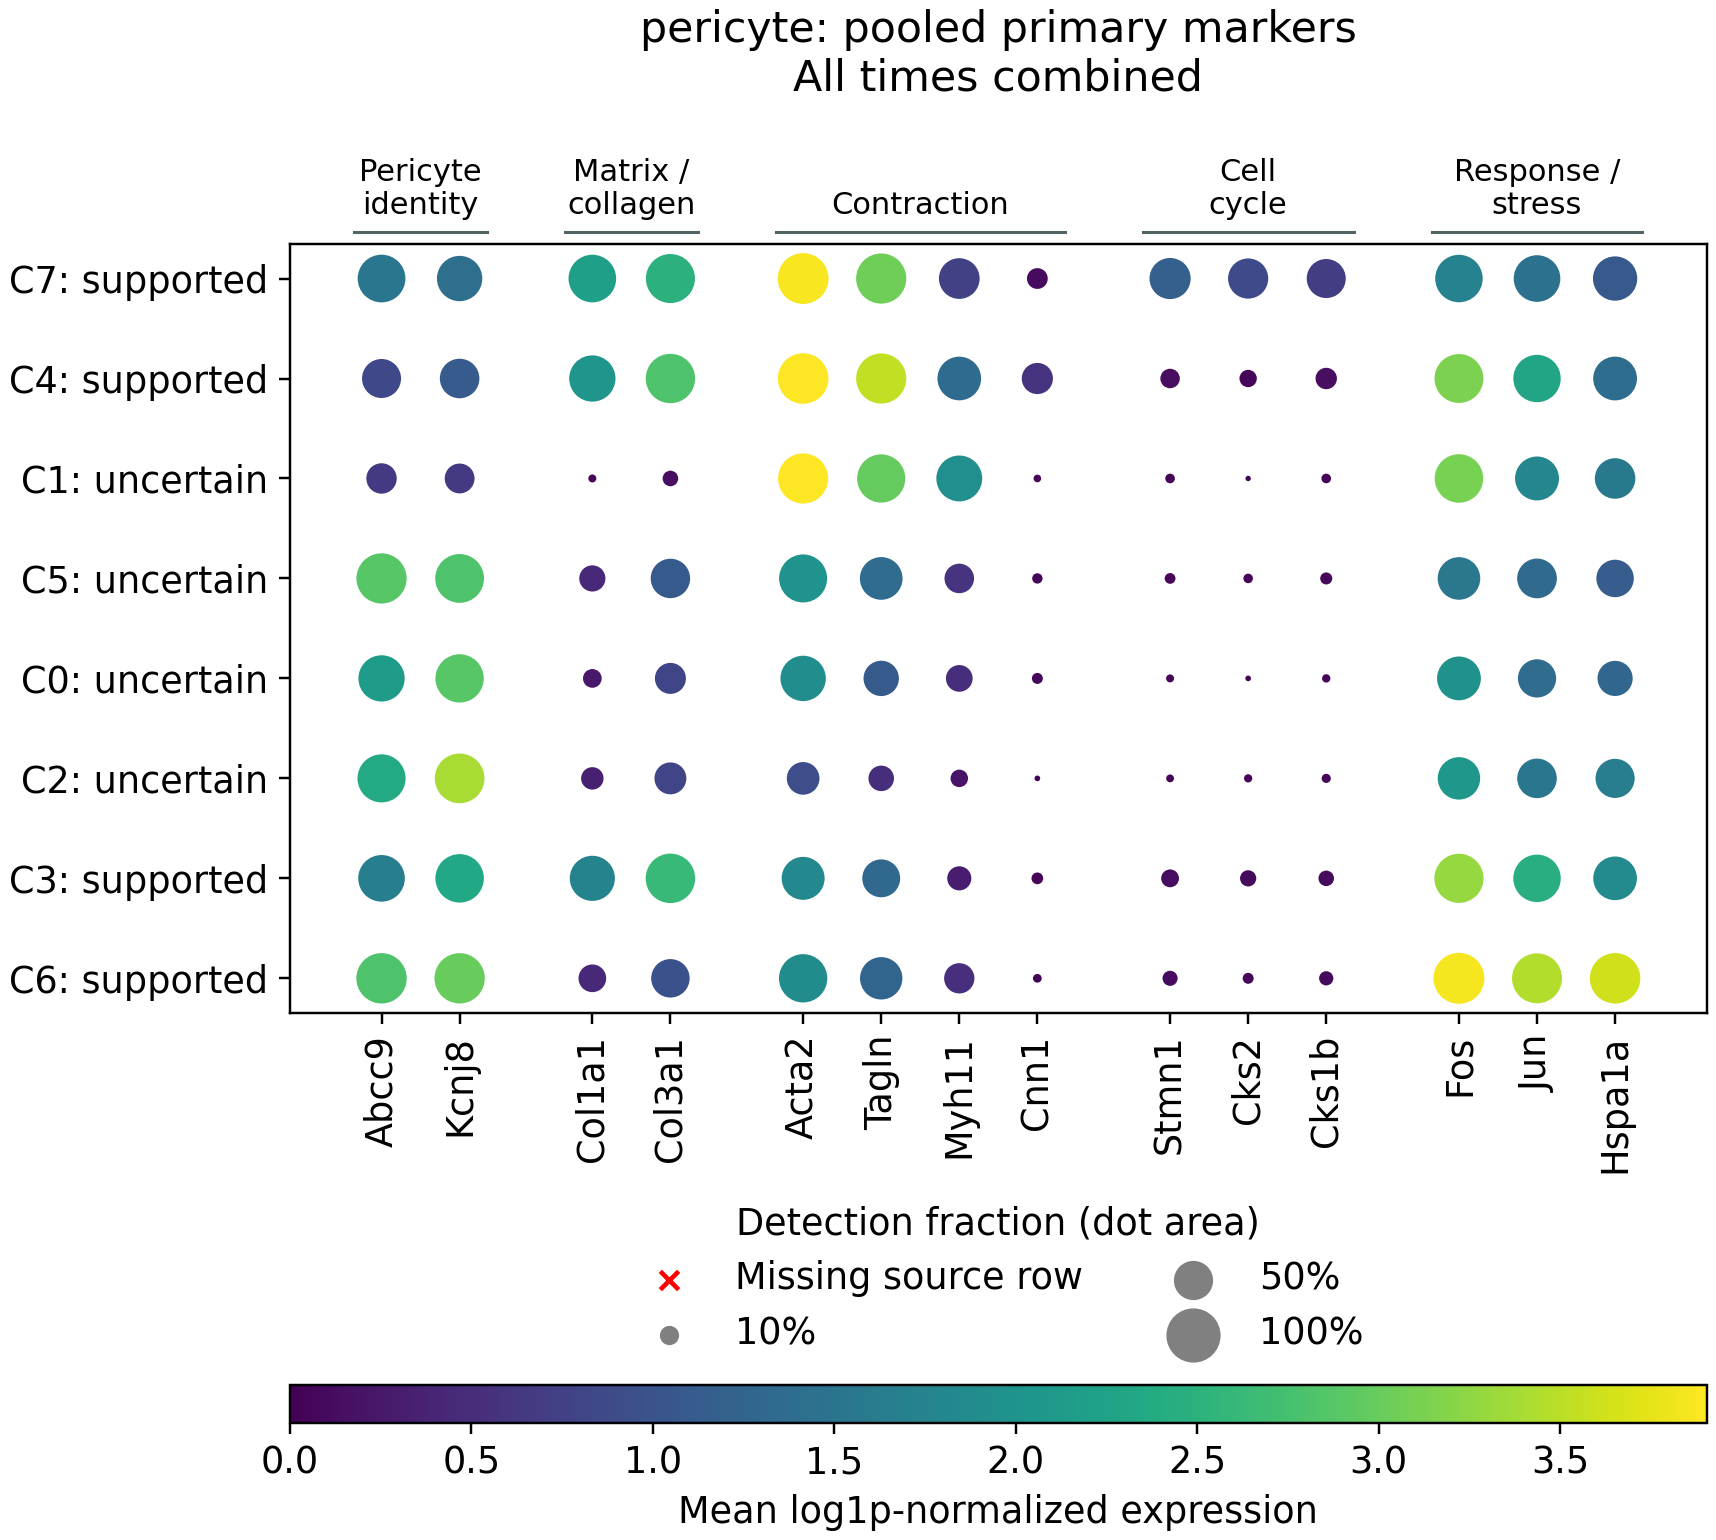
C3 versus C4 — matrix and contraction. Both express Col1a1/Col3a1, which encode structural collagens in the material surrounding cells. C4 has stronger Acta2/Tagln/Myh11 expression. These genes, together with Cnn1, are associated with contraction machinery.
C7 — an added cell-cycle pattern. Stmn1/Cks2/Cks1b, associated with microtubule regulation and cell-cycle control, have higher expression alongside matrix and contraction-related genes.
C6 — a response/stress pattern. Fos/Jun regulate rapid cellular responses; Hspa1a encodes a stress-responsive protein chaperone. Their stronger expression distinguishes C6.
How confidently can I interpret these clusters?
Supported RNA-pattern descriptions: C3, C4, C6 and C7. Several genes justify describing C3 as matrix-associated, C4 as matrix/contractile, C7 as cycling/matrix/contractile and C6 as response/stress-associated. Support applies to these biological descriptions; it does not validate the exact cluster boundaries or establish stable cell subtypes.
Uncertain separation into finer states: C0, C2 and C5. Abcc9/Kcnj8 expression supports a broad pericyte interpretation, but the similar low-matrix patterns do not adequately justify three separate biological states. The algorithm separated these cells; whether that separation is biologically meaningful remains uncertain.
Uncertain biological identity: C1. The combination of pericyte-associated and contractile RNA does not resolve what this cluster represents. Here the uncertainty concerns identity, not just how finely the cells were clustered.
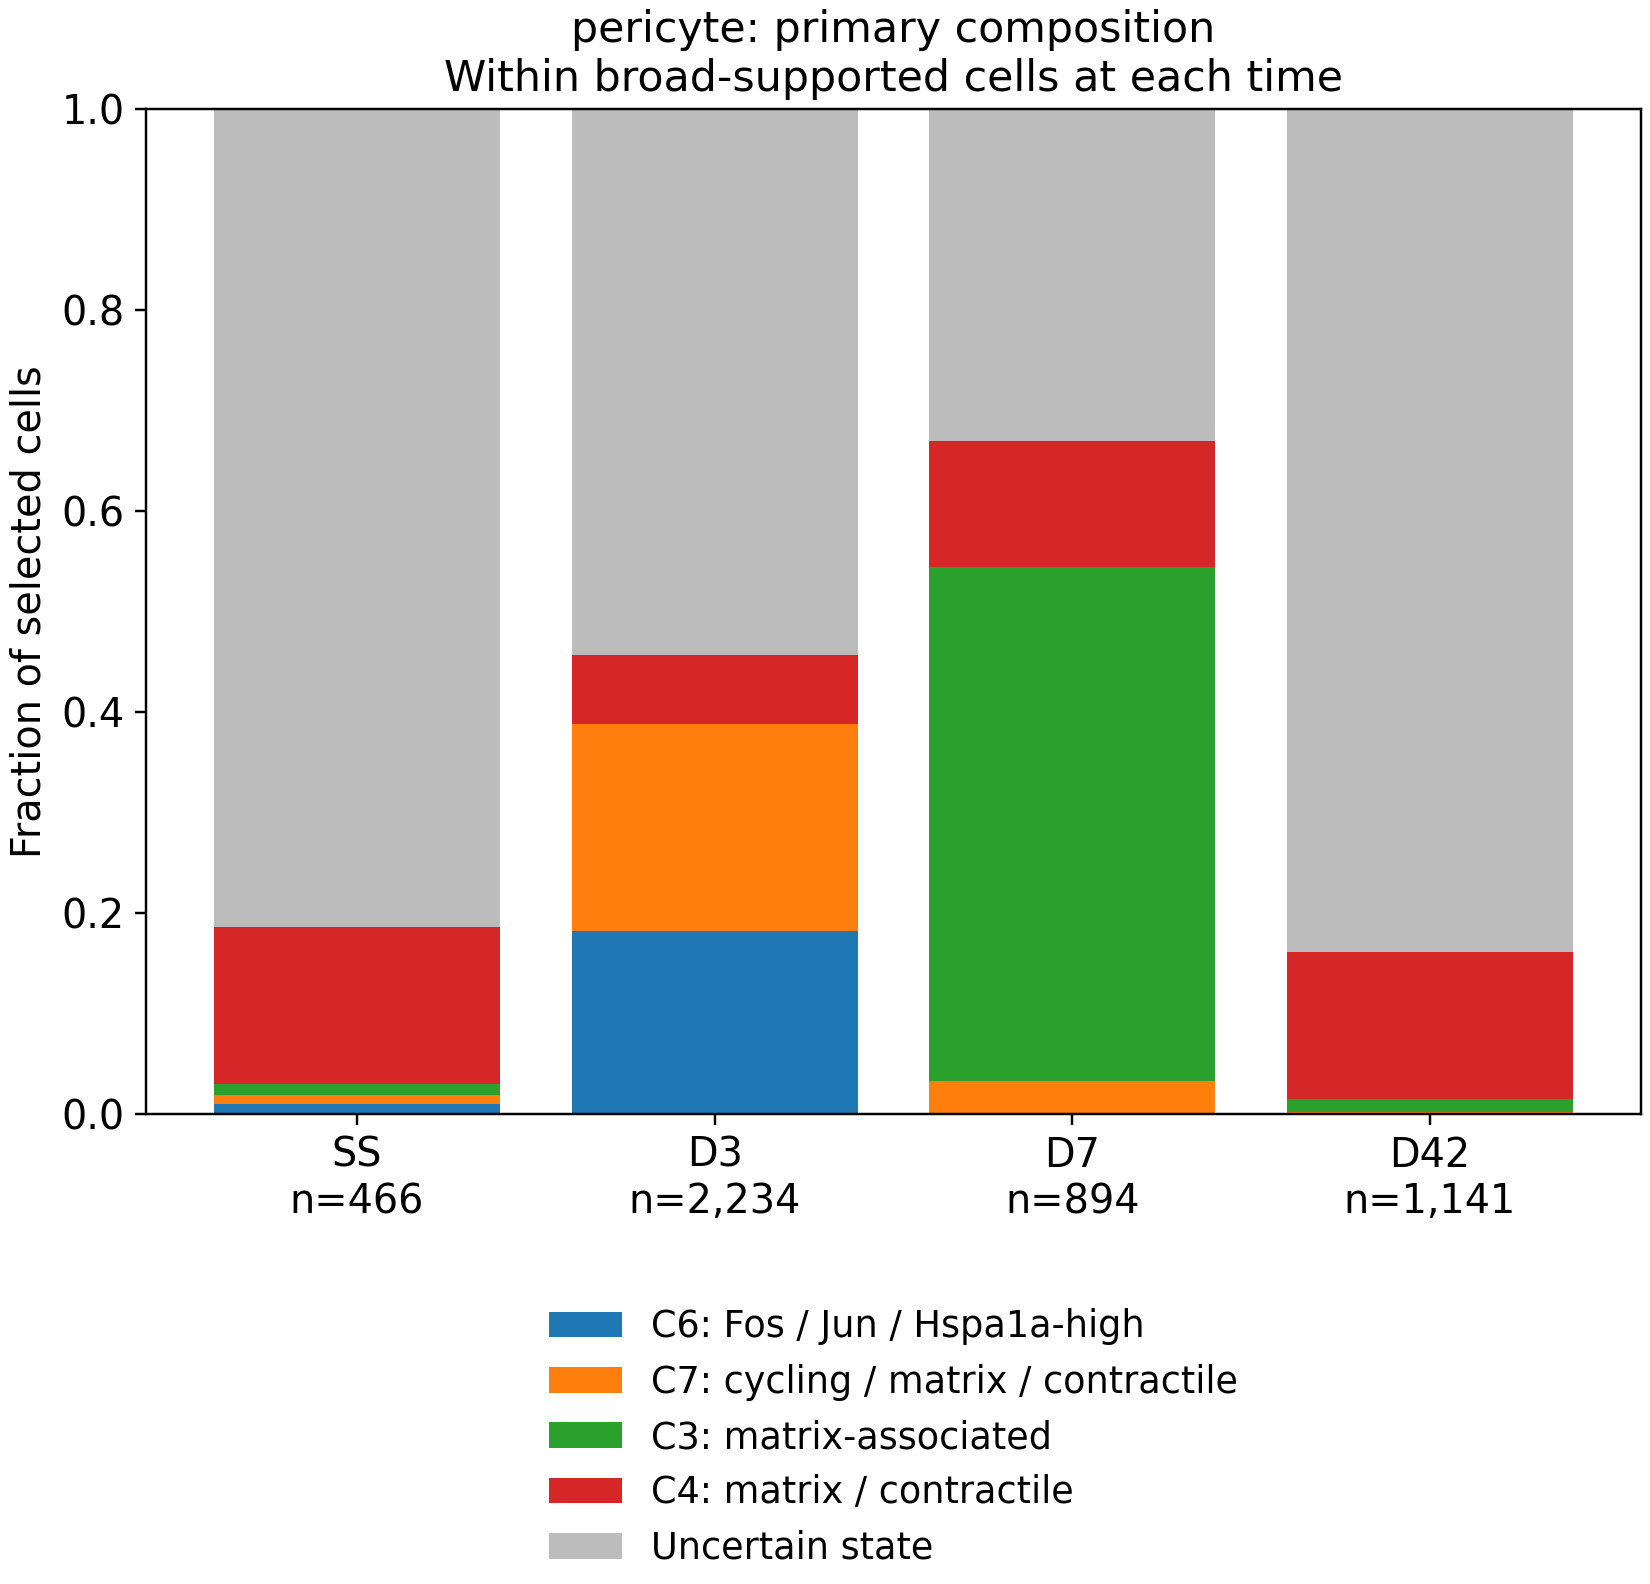
Figure B · Pericyte state composition · Open image
How are the RNA patterns represented across sampling times?
D3 — cell-cycle and response/stress patterns. C7 accounts for 21% of sampled pericyte-like cells (460 of 2,234), and C6 for 18% (408 of 2,234). These are the cell-cycle-associated and response/stress-associated clusters described in Figure A.
D7 — a prominent matrix-associated cluster. C3 accounts for 51% of sampled pericyte-like cells (457 of 894). Its collagen-related RNA pattern is the largest segment at this time.
The matrix/contractile pattern is not exclusive to injury. C4 is also present at steady state (SS): 73 of 466 sampled cells, or 16%.
How confidently can I interpret these proportions?
Gray means an uncertain finer state, not an uncertain count. These cells passed the broad pericyte-like assignment, but their finer RNA-pattern labels remain unresolved. They stay in the totals so the colored clusters are not overstated.
The bars describe sampled cells, not whole hearts. Each bar totals the pericyte-like cells recovered at that time; the numbers count cells, not mice. Cell selection and processing can affect these proportions, and missing animal identities prevent assessing their consistency across mice.
Different proportions do not show cells changing state. The bars compare separate samples. They do not follow individual cells from one time to the next.
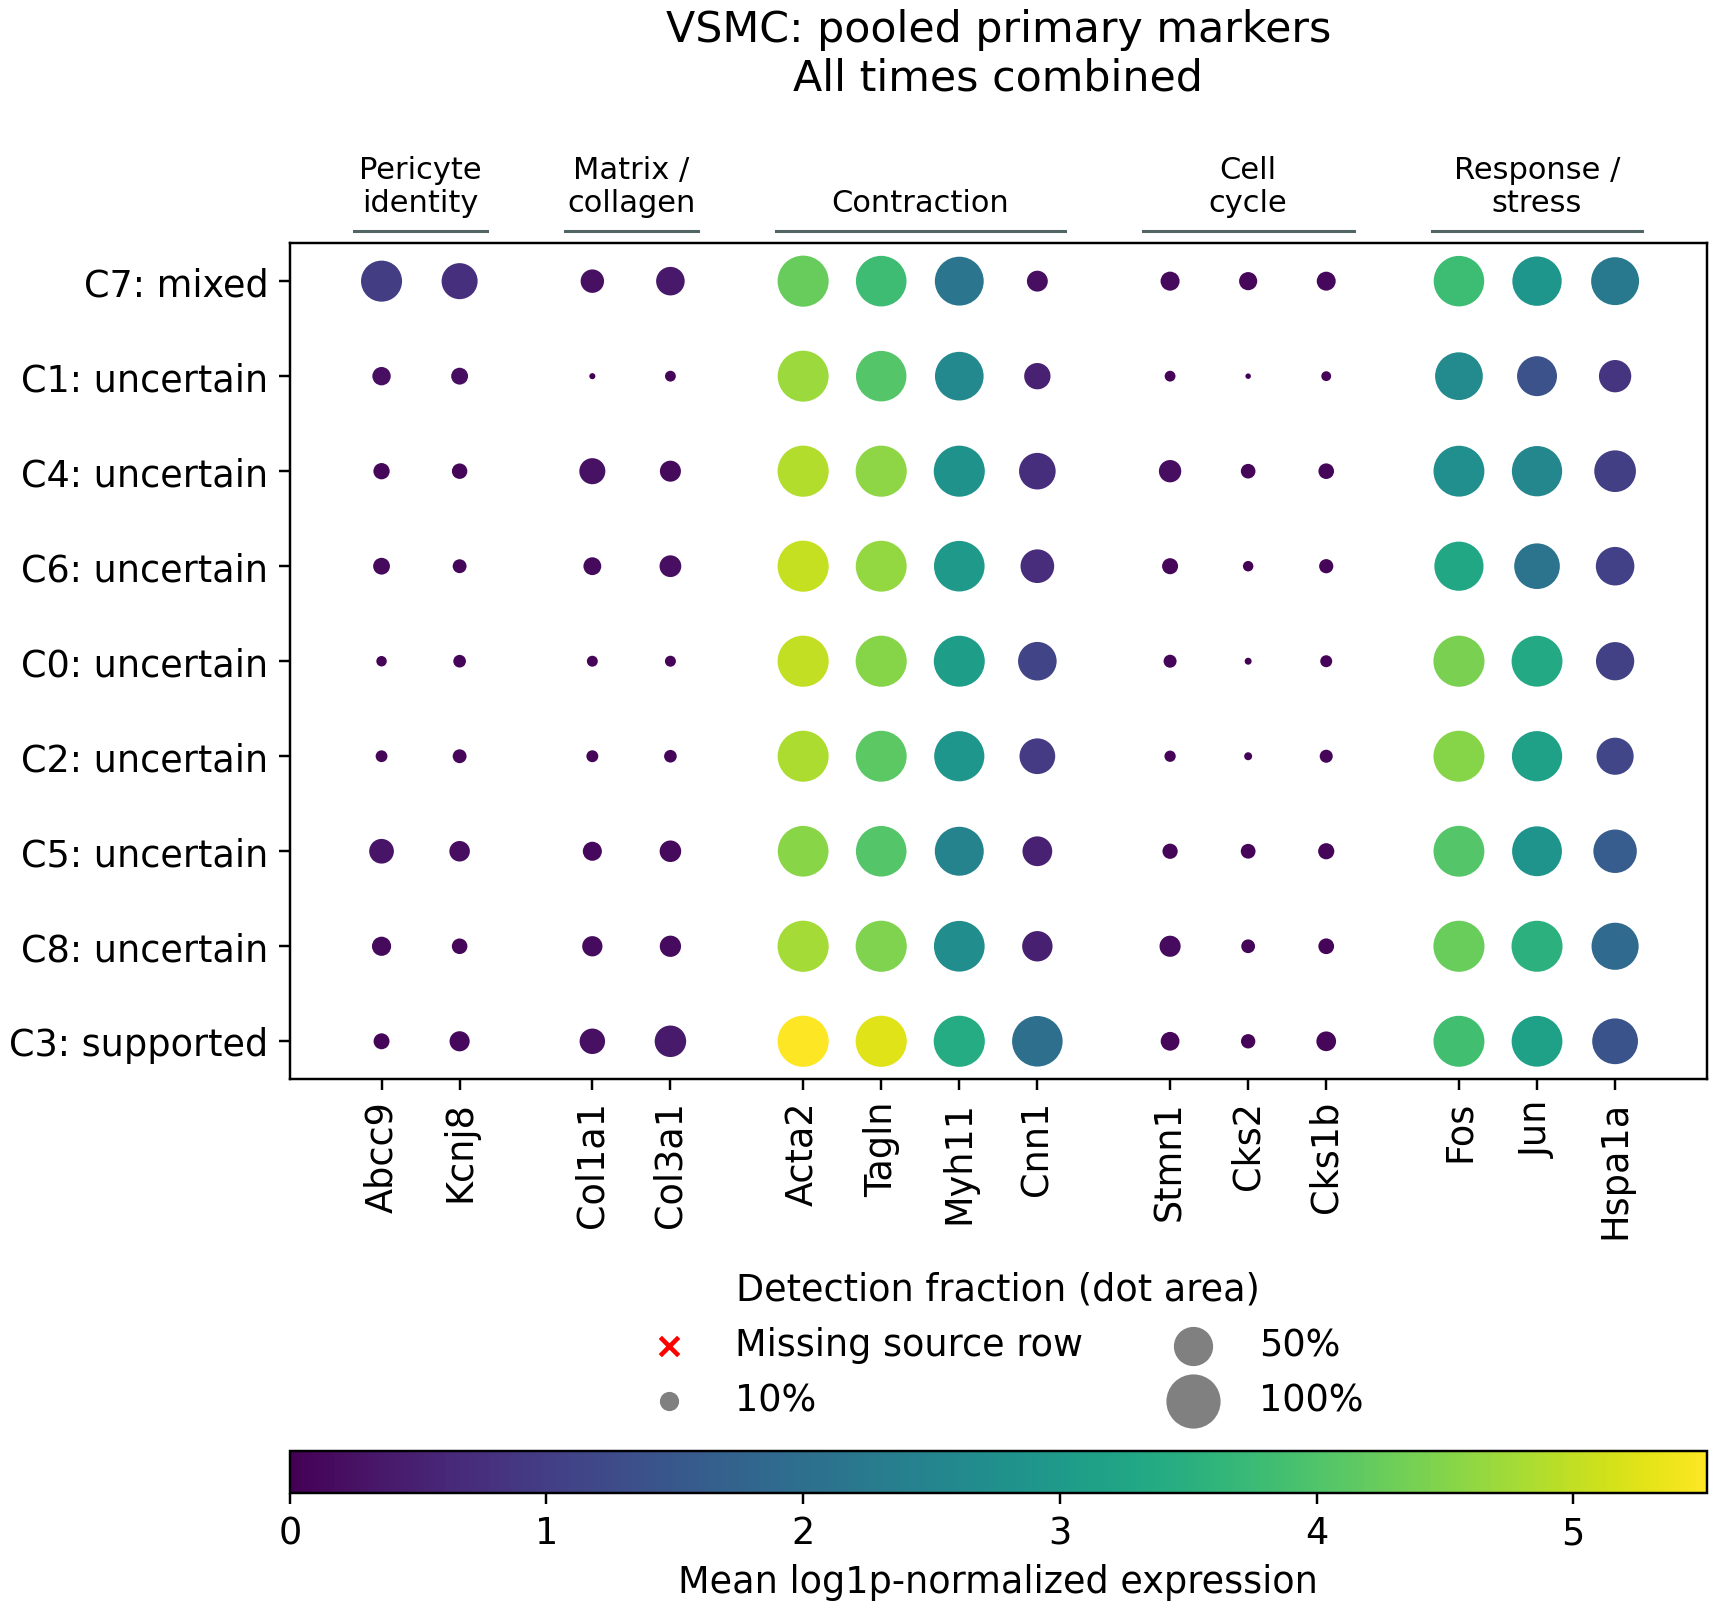
C3 — stronger contraction-related expression. Acta2/Tagln/Myh11/Cnn1, associated with the contraction machinery of smooth muscle cells, show higher expression together. Several genes distinguish this pattern, not Cnn1 alone.
C7 — overlapping mural-cell markers. Contraction-related genes occur alongside Abcc9/Kcnj8, which encode potassium-channel components associated with pericytes. This combination blurs the distinction between vascular smooth muscle and pericyte-like identity.
How confidently can I interpret these clusters?
Supported RNA-pattern description: C3. Several contraction-related genes have higher expression in C3, supporting its description as a cluster with stronger contraction-related RNA expression. This does not show that the cells actually contract more strongly.
Uncertain separation into finer states: C0, C1, C2, C4, C5, C6 and C8. Contraction-related expression supports the broad VSMC-like description, but the evidence does not adequately justify each subdivision as a distinct biological state. Algorithmic separation alone is not enough.
Uncertain biological identity: C7. The overlapping markers leave this cluster mixed or unresolved. They could reflect shared mural-cell biology or mixed cell measurements; the plot cannot distinguish these explanations.
How is the contraction-related RNA pattern represented across sampling times?
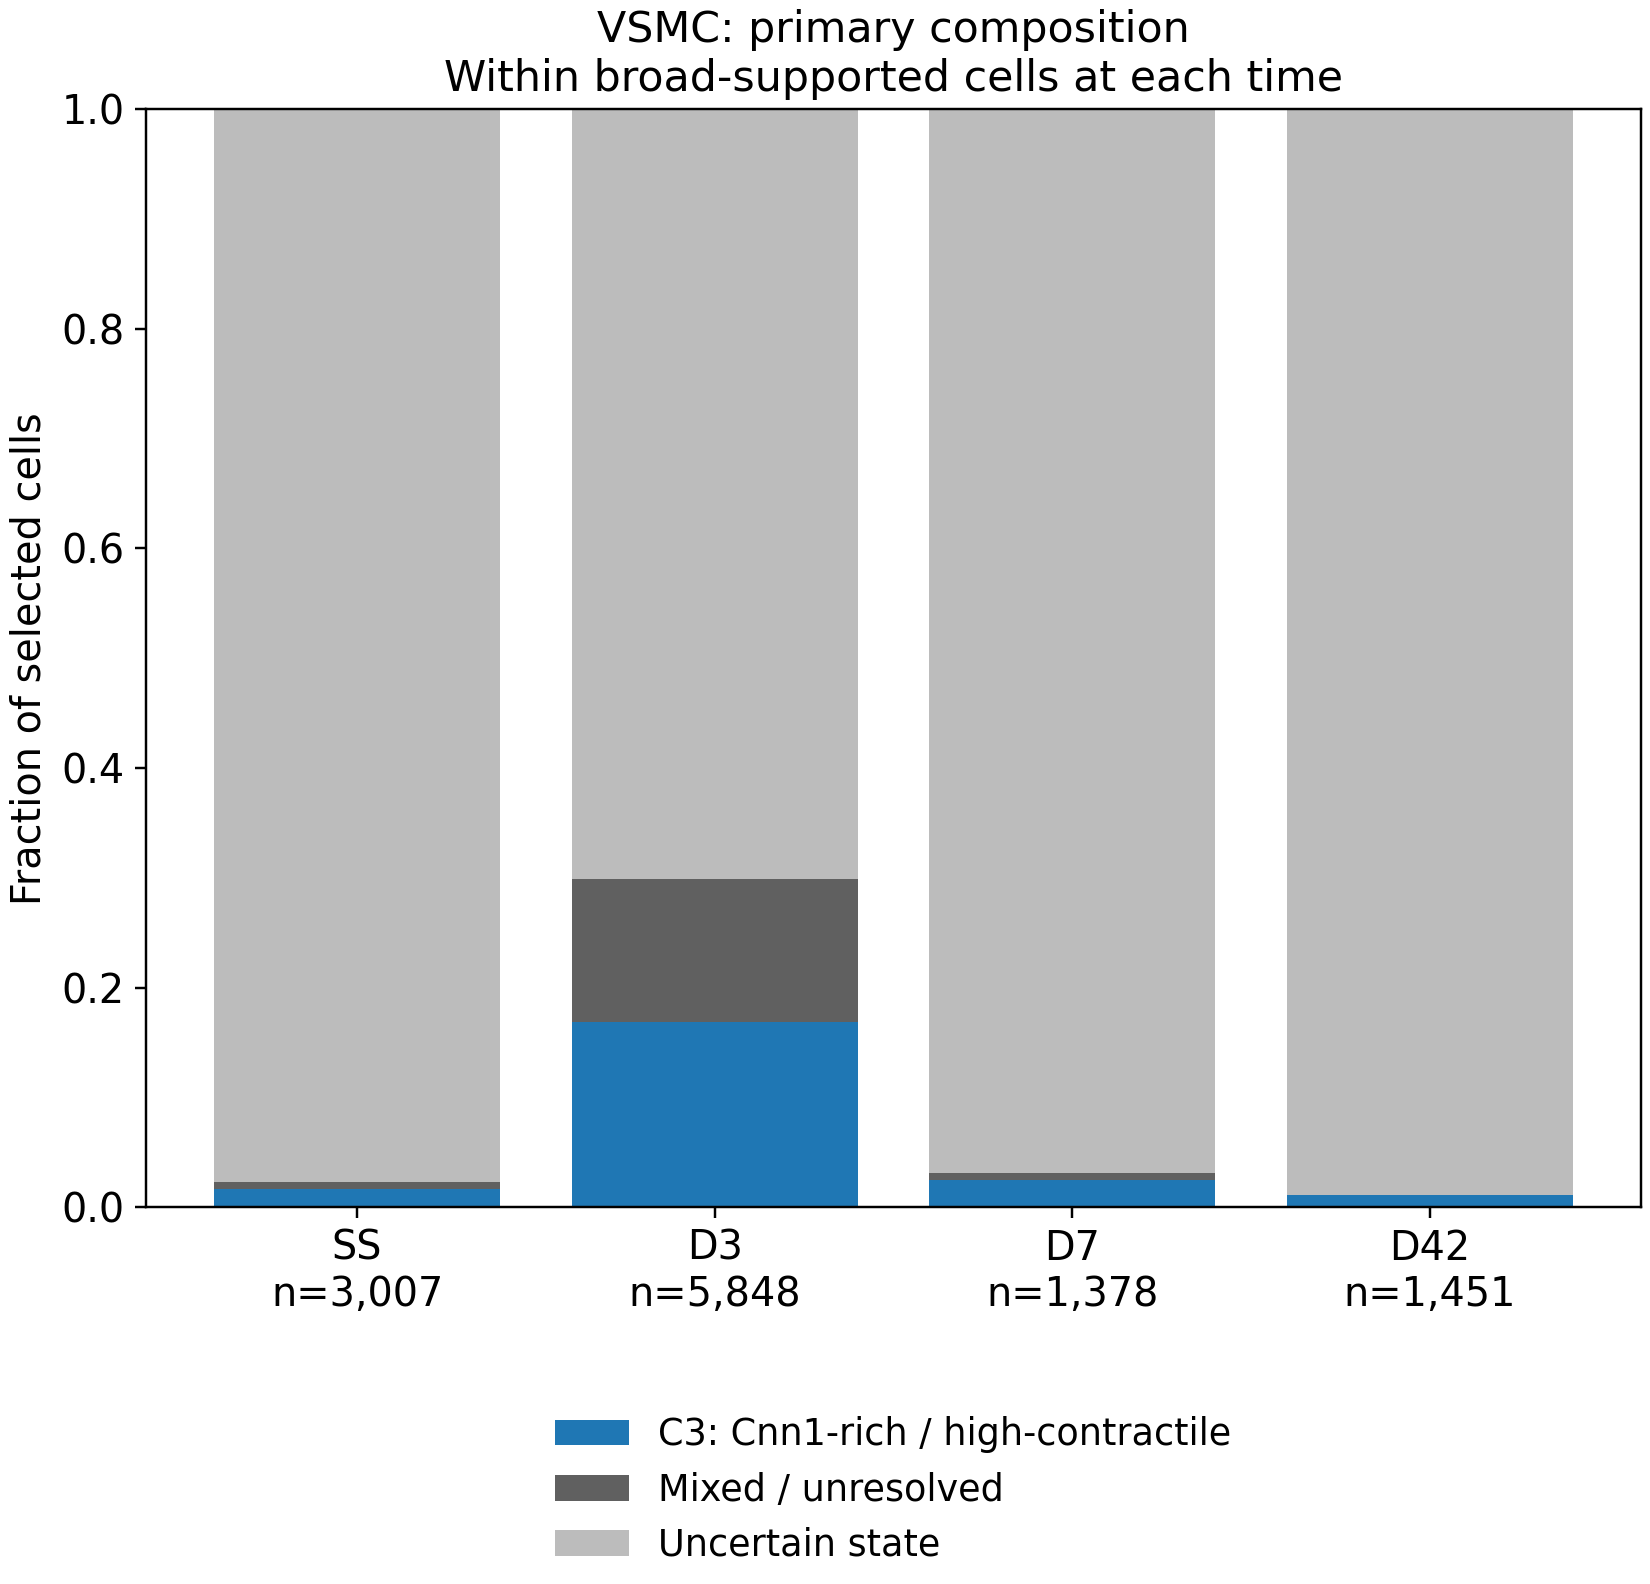
C3 is most represented at D3. The blue segment contains 989 of 5,848 sampled VSMC-like cells (17%) at D3. This is the cluster with stronger contraction-related RNA expression described in Figure C.
C3 is also present at the other times. It accounts for 1.7% at steady state (SS), 2.5% at D7 and 1.1% at D42. The pattern is therefore not exclusive to the early injury sample.
How confidently can I interpret these proportions?
Light gray — uncertain finer states. These cells have a broad VSMC-like assignment, but the evidence does not justify distinct names for their subdivisions. At D3, they account for 70% of the sample (4,100 cells). Uncertain labels do not mean the cells lack biological differences.
Dark gray — mixed or unresolved identity. C7 combines smooth-muscle and pericyte-associated RNA, leaving its identity unresolved. It accounts for 13% at D3 (759 cells). Both gray categories remain in the totals so C3’s share is not overstated.
The bars describe sampled cells, not whole hearts. The totals count cells, not mice. Cell selection and processing can affect these proportions, and missing animal identities prevent assessing their consistency across mice. Separate samples also cannot show individual cells changing state over time.
Pericyte annotation: Concordant evidence from at least two of Kcnj8, Abcc9, Colec11 and Vtn, with competing identities and mixed expression reviewed—not an automatic two-marker cutoff.
Do the same cells retain their pericyte label when the analysis changes?
Follow the original 497 C7 cells. Every row tracks the same cell IDs. Blue means a confident broad pericyte assignment; gray means the cell remains but has another or unresolved assignment. Red would indicate a removed cell.
Stricter filtering: 16 retain the label. The stricter gene-count filter raises the requirement from more than 200 to more than 300 detected genes per cell, followed by rebuilt broad clustering and annotation. All 497 C7 cells pass, but only 16 still receive a confident pericyte label.
Coarser clustering: 26 retain the label. Lowering the Leiden resolution from 0.5 to 0.25 produces a coarser partition of the cells. Again, all 497 cells remain, but only 26 receive a confident pericyte label.
What does this tell me about C7?
The labels change; the cells are not lost. A separate check also found identical normalized gene-expression values for these cells before and after stricter gene-count filtering. Their changed labels reflect the altered clustering and annotation context, not disappearance of the cells or their RNA pattern.
The pericyte interpretation depends on analysis choices. This weakens confidence in assigning all C7 cells to pericytes, but does not tell me which assignment is correct. The blue counts track broad pericyte identity, not whether the original C7 cluster is recovered.